Voila & Widgets
Using Juyper-flex with Voila you can create dashboards that change dynamically when the parameters are changed. This is done by adding runtime, a Jupyter kernel, and one or more controls inputs that dynamically drive the appearance of the components within the dashboard.
Voila turns a Jupyter Notebook into an interactive document. It's important to note that interactive documents need to be deployed using Voila to be shared broadly, whereas static html documents generated by nbconvert that can be easily shared such as attached to an email or served from a web server.
Getting Started
The steps required to make an interactive dashboard can be summarized as:
- Create one Section, level-2 markdown header (
##) - On this section add some code that shows
ipywidgetscontrols and tag the cell withbody(same as any other content) - Add one or multiple regular Jupyter-flex Sections (
##) - Create an Output ipywidget that holds the outputs for the dashboard
- Use the
interact()orobserve()functions fromipywidgetsto update Output widget - Tag a code cell that outputs the Output widget with
body - Run the notebook using
voila
Simple example
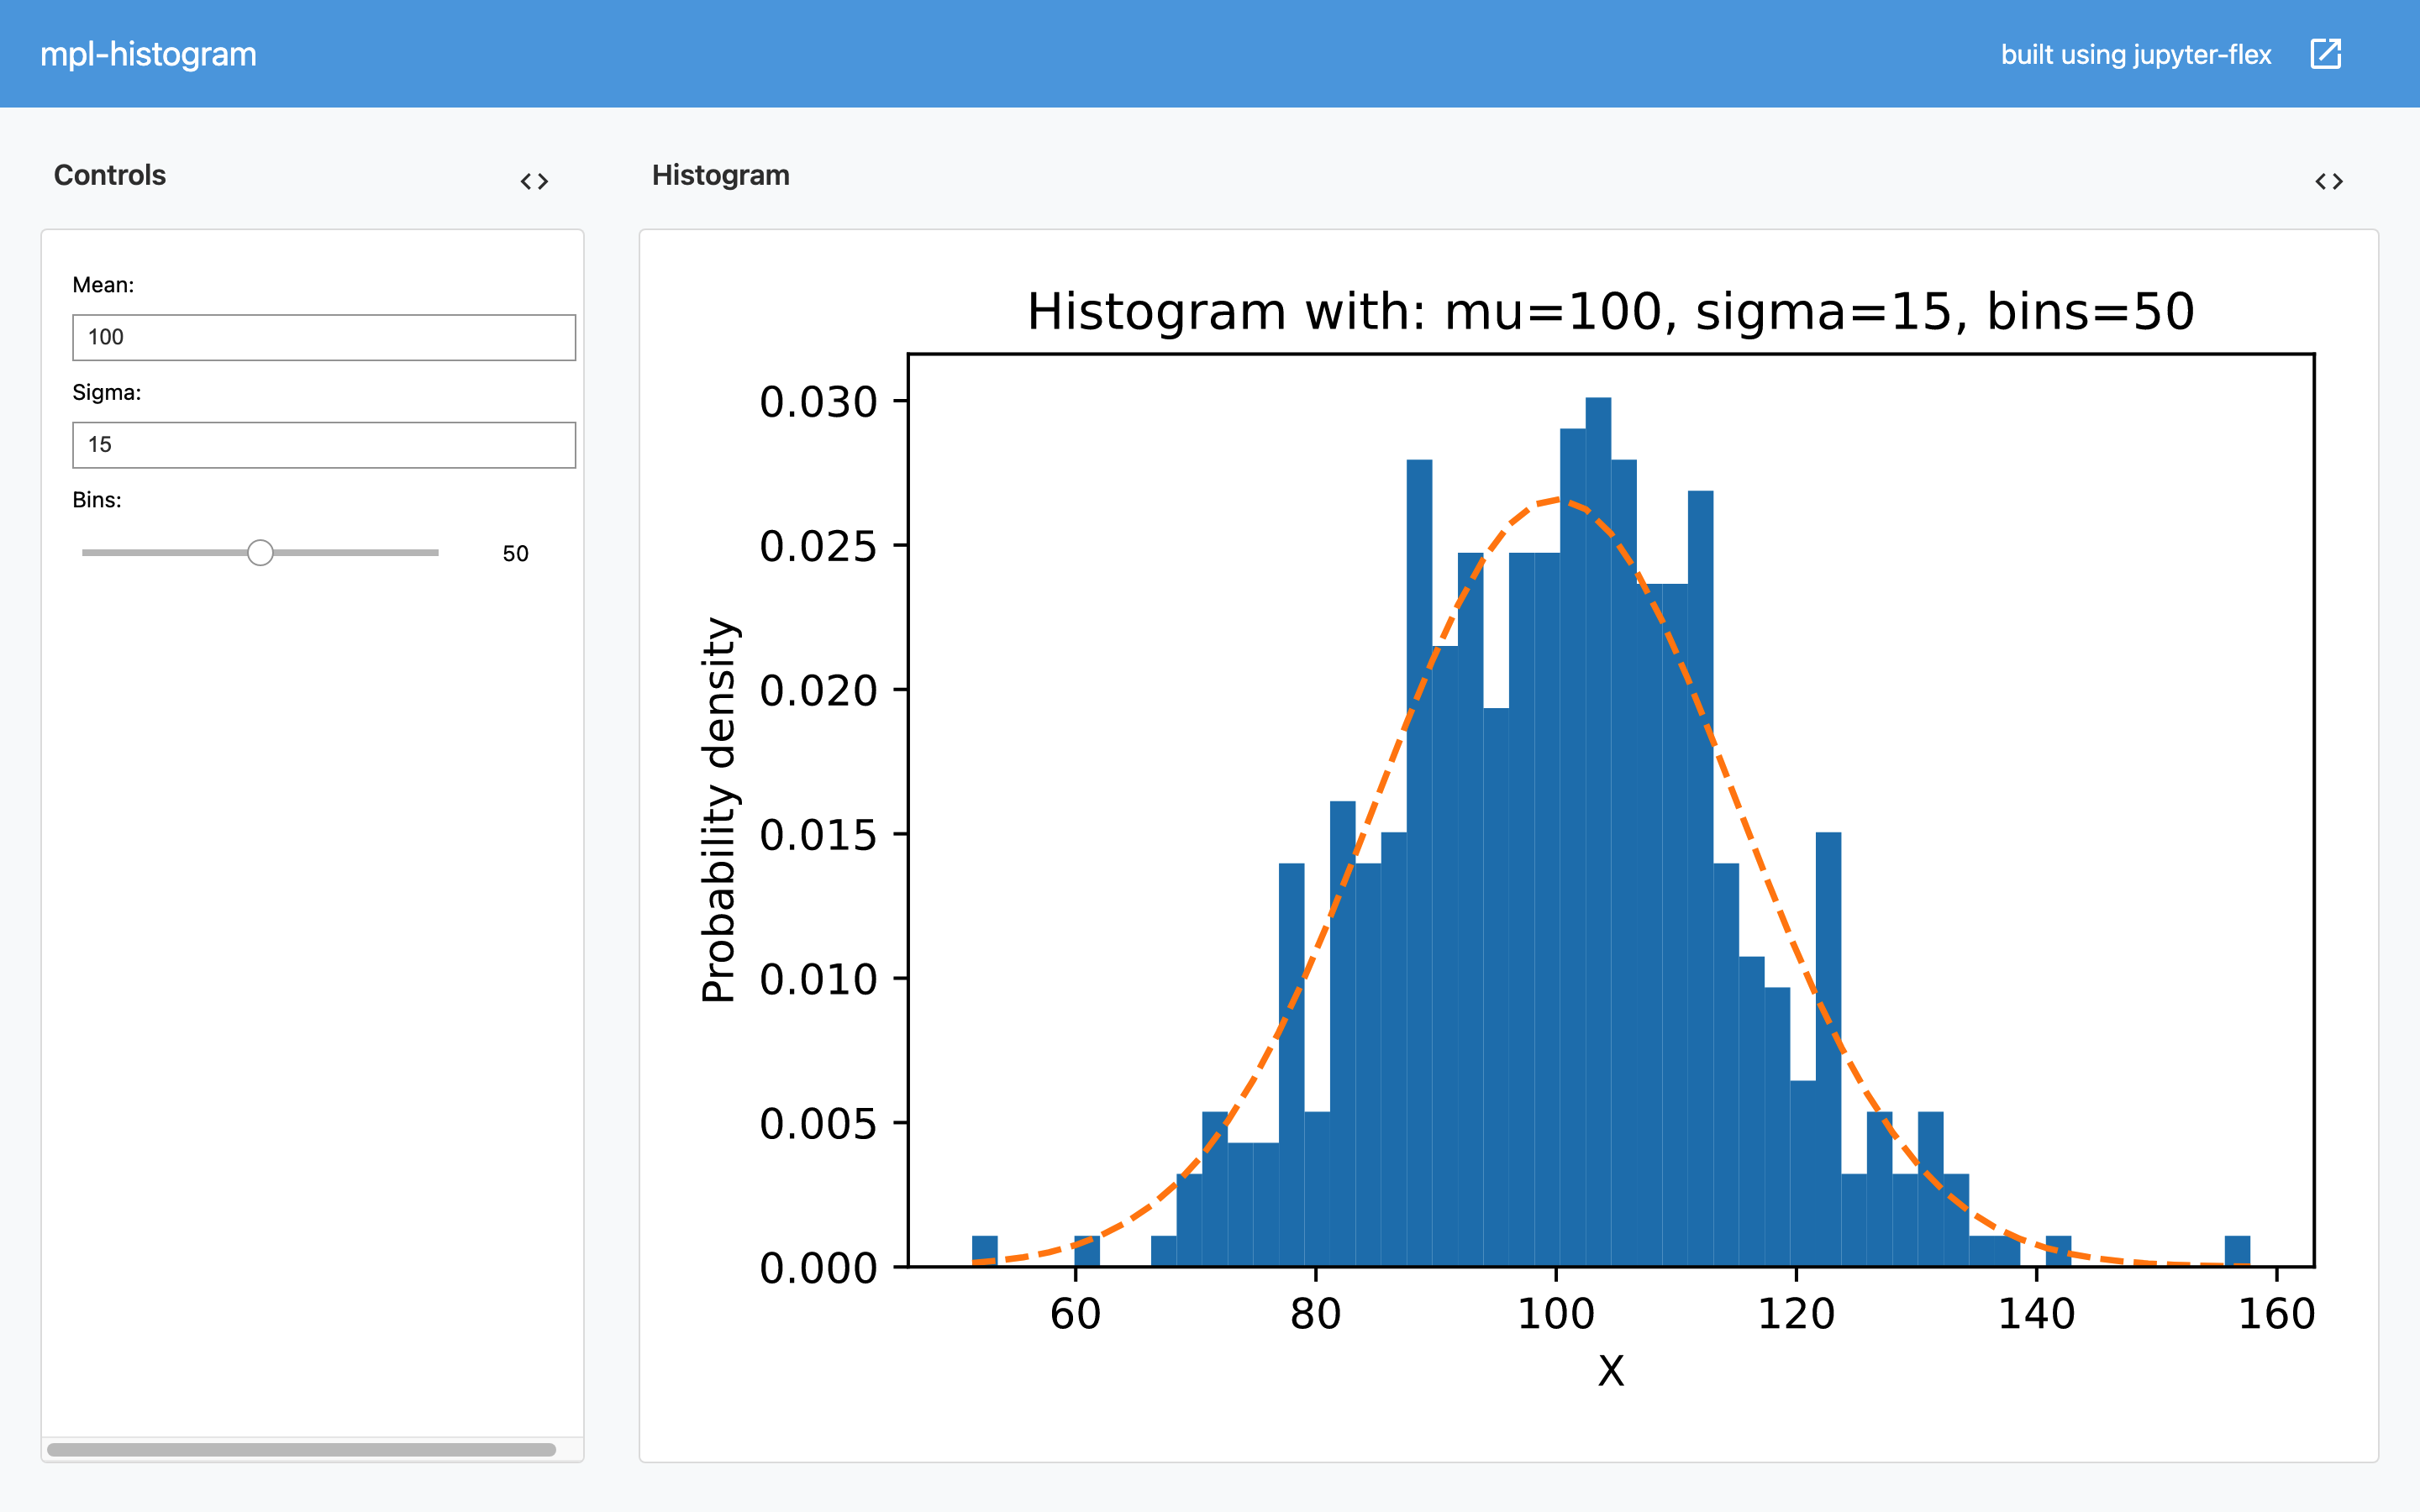
Let's do a simple example using ipywidgets to generate a random distribution and plot a histogram using matplotlib.
This dashboard will contain 3 widgets to control the mean and standard deviation of the data and number of bins of the histogram.
import numpy as np
import ipywidgets as widgets
from IPython.display import clear_output, display

import matplotlib.pyplot as plt
from IPython.display import set_matplotlib_formats
%matplotlib inline
set_matplotlib_formats('svg')

np.random.seed(42)
/tmp/ipykernel_3500/2307025751.py:8: DeprecationWarning: `set_matplotlib_formats` is deprecated since IPython 7.23, directly use `matplotlib_inline.backend_inline.set_matplotlib_formats()`
  set_matplotlib_formats('svg')
Matplotlib output format
Since we are gonna use matplotlib to plot the histogram we set the format to be SVG, this looks better on the final dashboard because the plot is more responsive.
For more information on the different plotting library options see Plotting.
1. Sidebar Section
Create a new section and change the size to 250.
## Section
2. Widgets
Create 3 ipython widgets: 2 integer inputs and 1 slider and tag the cell with body.
We use a VBox and we make the labels their own widget instead of using a description in order to make it look better in the final dashboard.
mu_label = widgets.Label(value="Mean:")
mu_var = widgets.BoundedIntText(value=100, min=10, max=300)
sigma_label = widgets.Label(value="Sigma:")
sigma_var = widgets.BoundedIntText(value=15, min=10, max=50)
bins_label = widgets.Label(value="Bins:")
bins_var = widgets.IntSlider(value=50, min=1, max=100, step=1)

widgets.VBox([mu_label, mu_var, sigma_label, sigma_var, bins_label, bins_var])
Note that widgets shown here as just displays, not connected to a kernel.
3. Section and outputs
Create a new section, change the size to 750.
## Column
4. Create Output widget
Create an Output widget object out that will hold the final plot.
out = widgets.Output()
5. Update plot based on widgets
We use the observe() function from ipywidgets to generate the data and create the plot inside the output widget.
def on_value_change(change):
    mu = mu_var.value
    sigma = sigma_var.value
    num_bins = bins_var.value

    with out:
        fig, ax = plt.subplots()

        # the histogram of the data
        x = mu + sigma * np.random.randn(437)
        n, bins, patches = ax.hist(x, num_bins, density=1)

        # add a 'best fit' line
        y = ((1 / (np.sqrt(2 * np.pi) * sigma)) * np.exp(-0.5 * (1 / sigma * (bins - mu))**2))
        ax.plot(bins, y, '--')

        ax.set_xlabel('X')
        ax.set_ylabel('Probability density')
        ax.set_title(f'Histogram with: mu={mu}, sigma={sigma}, bins={num_bins}')

        clear_output(wait=True)
        plt.show(fig)

mu_var.observe(on_value_change, names="value")
sigma_var.observe(on_value_change, names="value")
bins_var.observe(on_value_change, names="value")
6. Output
Finally we call the on_value_change() function once to create an initial plot.
Then we output the Output widget and tag that cell with body.
on_value_change(None)
out
7. Run voila
Now you can run voila using the flex template and point it to the notebook file.
$ voila --template=flex mpl-histogram.ipynb
This will open a browser window and the result show look like this, click on the image below to open this example on binder.org:
Examples
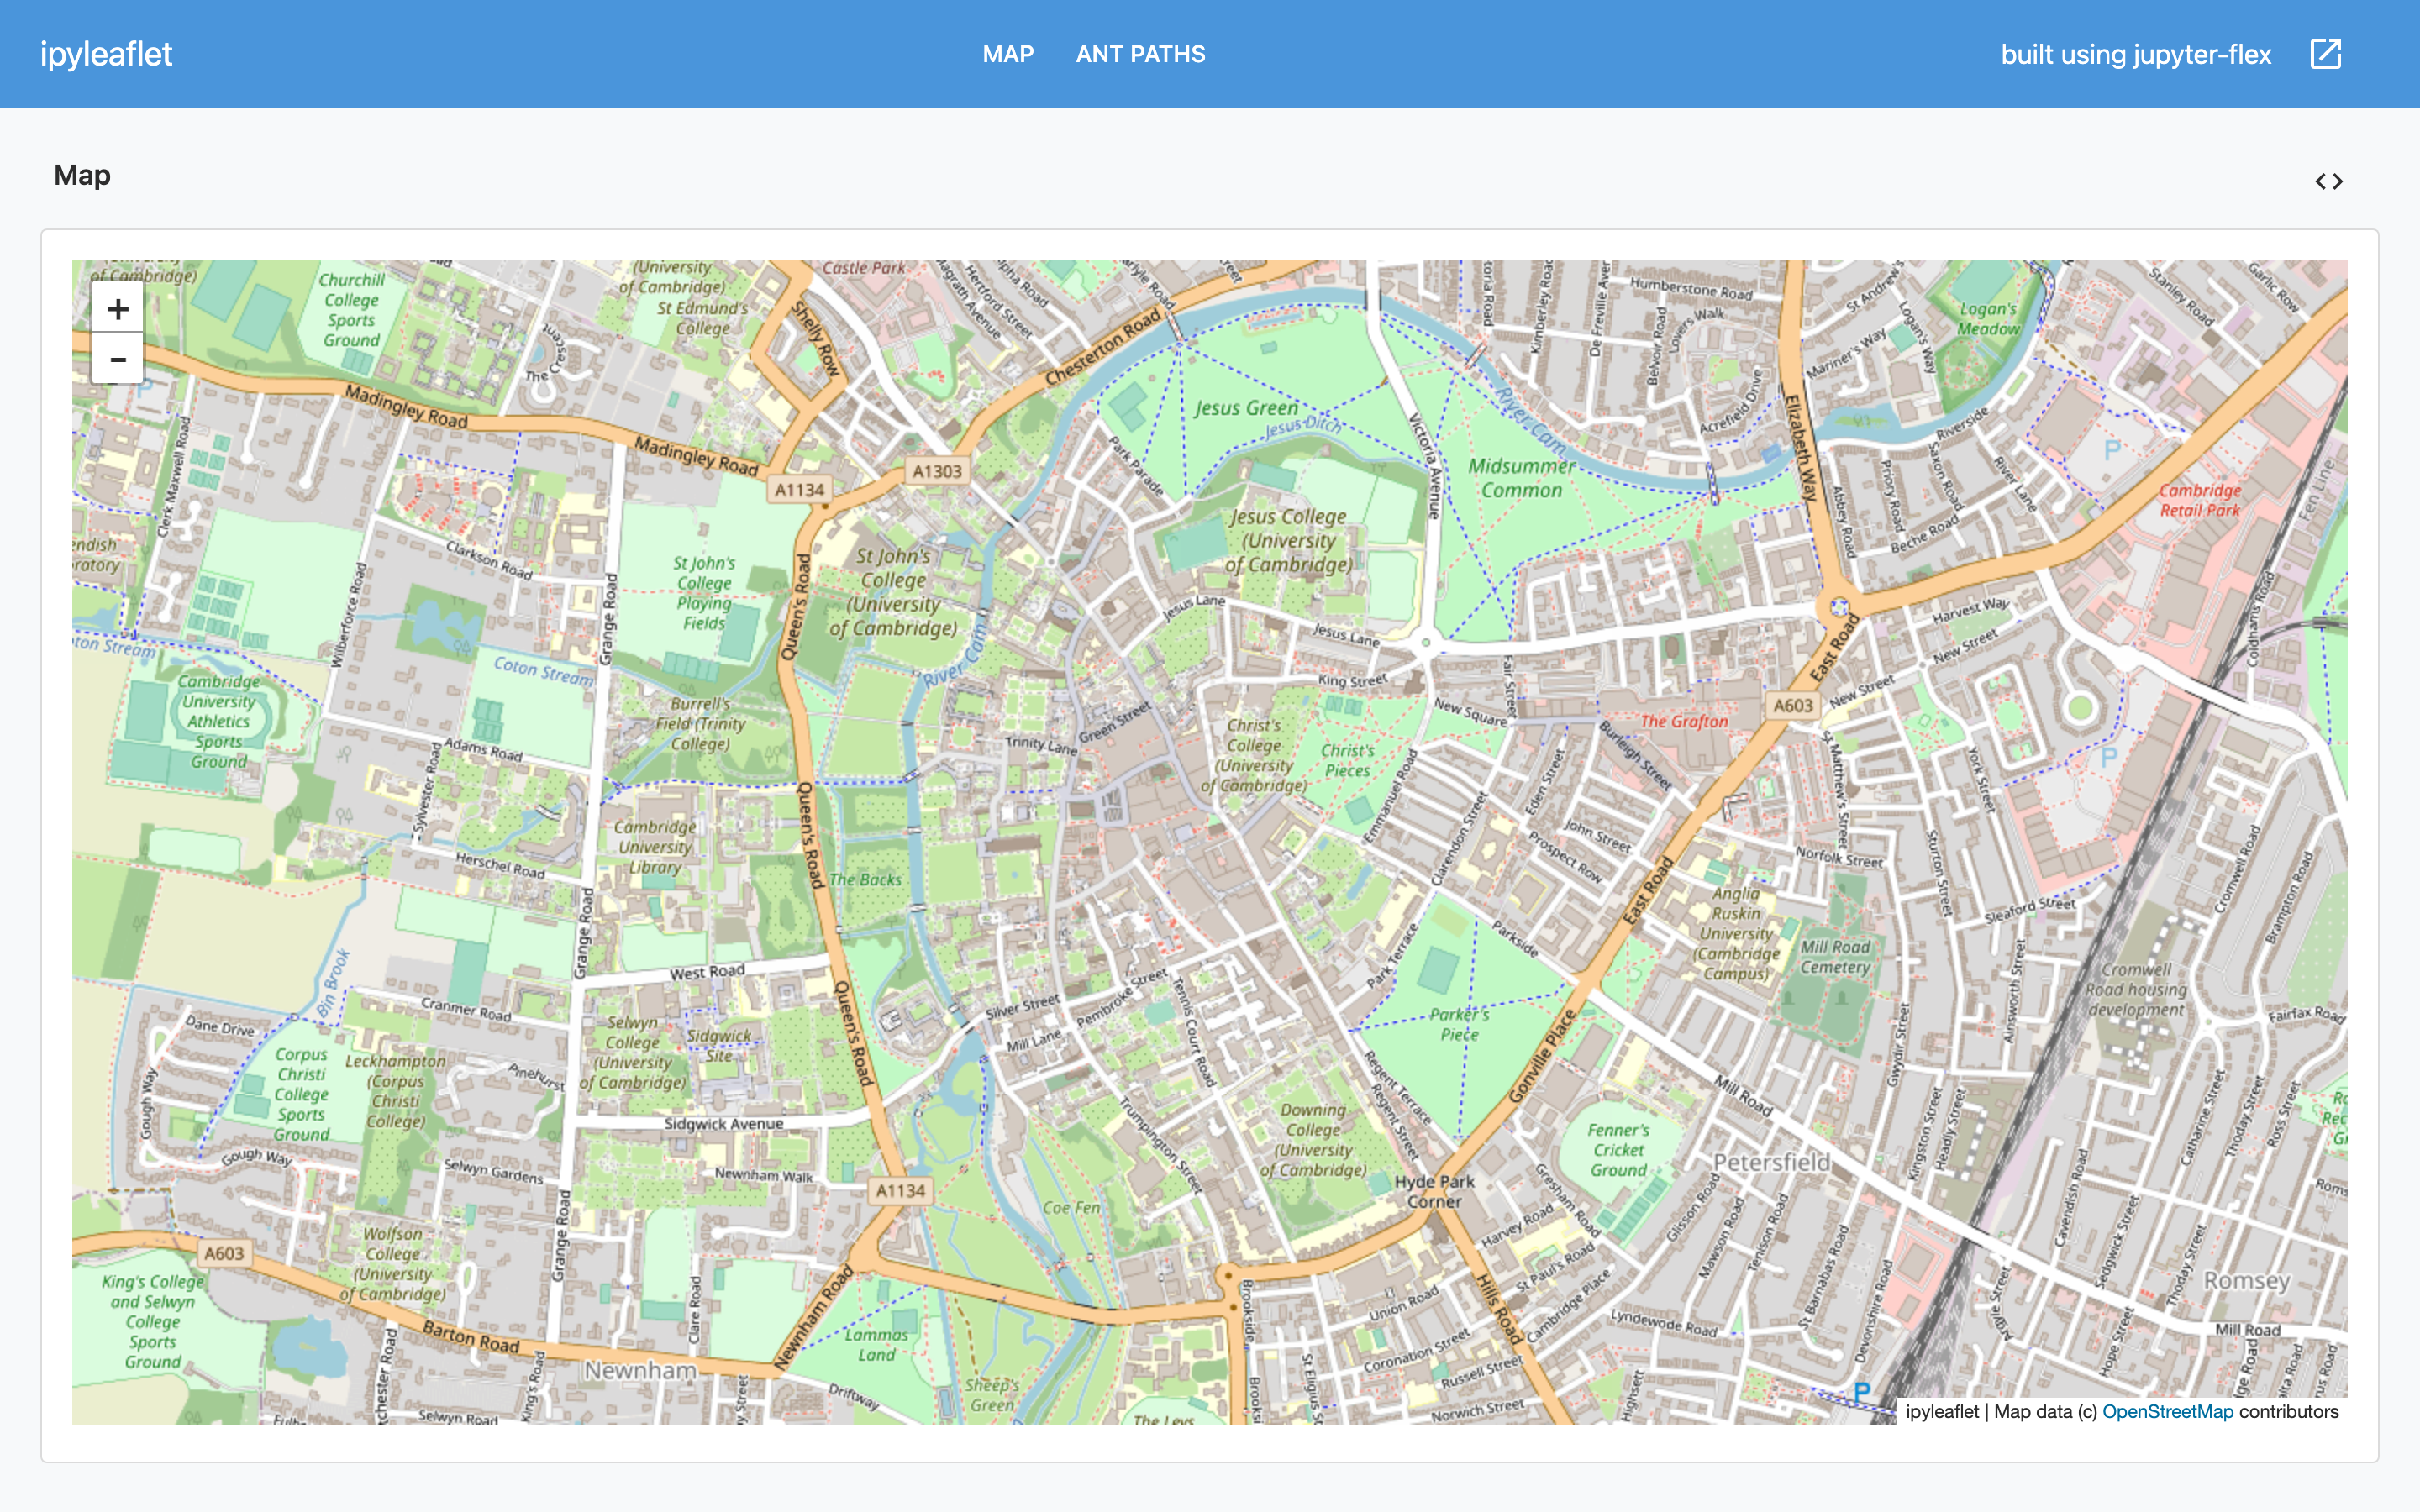
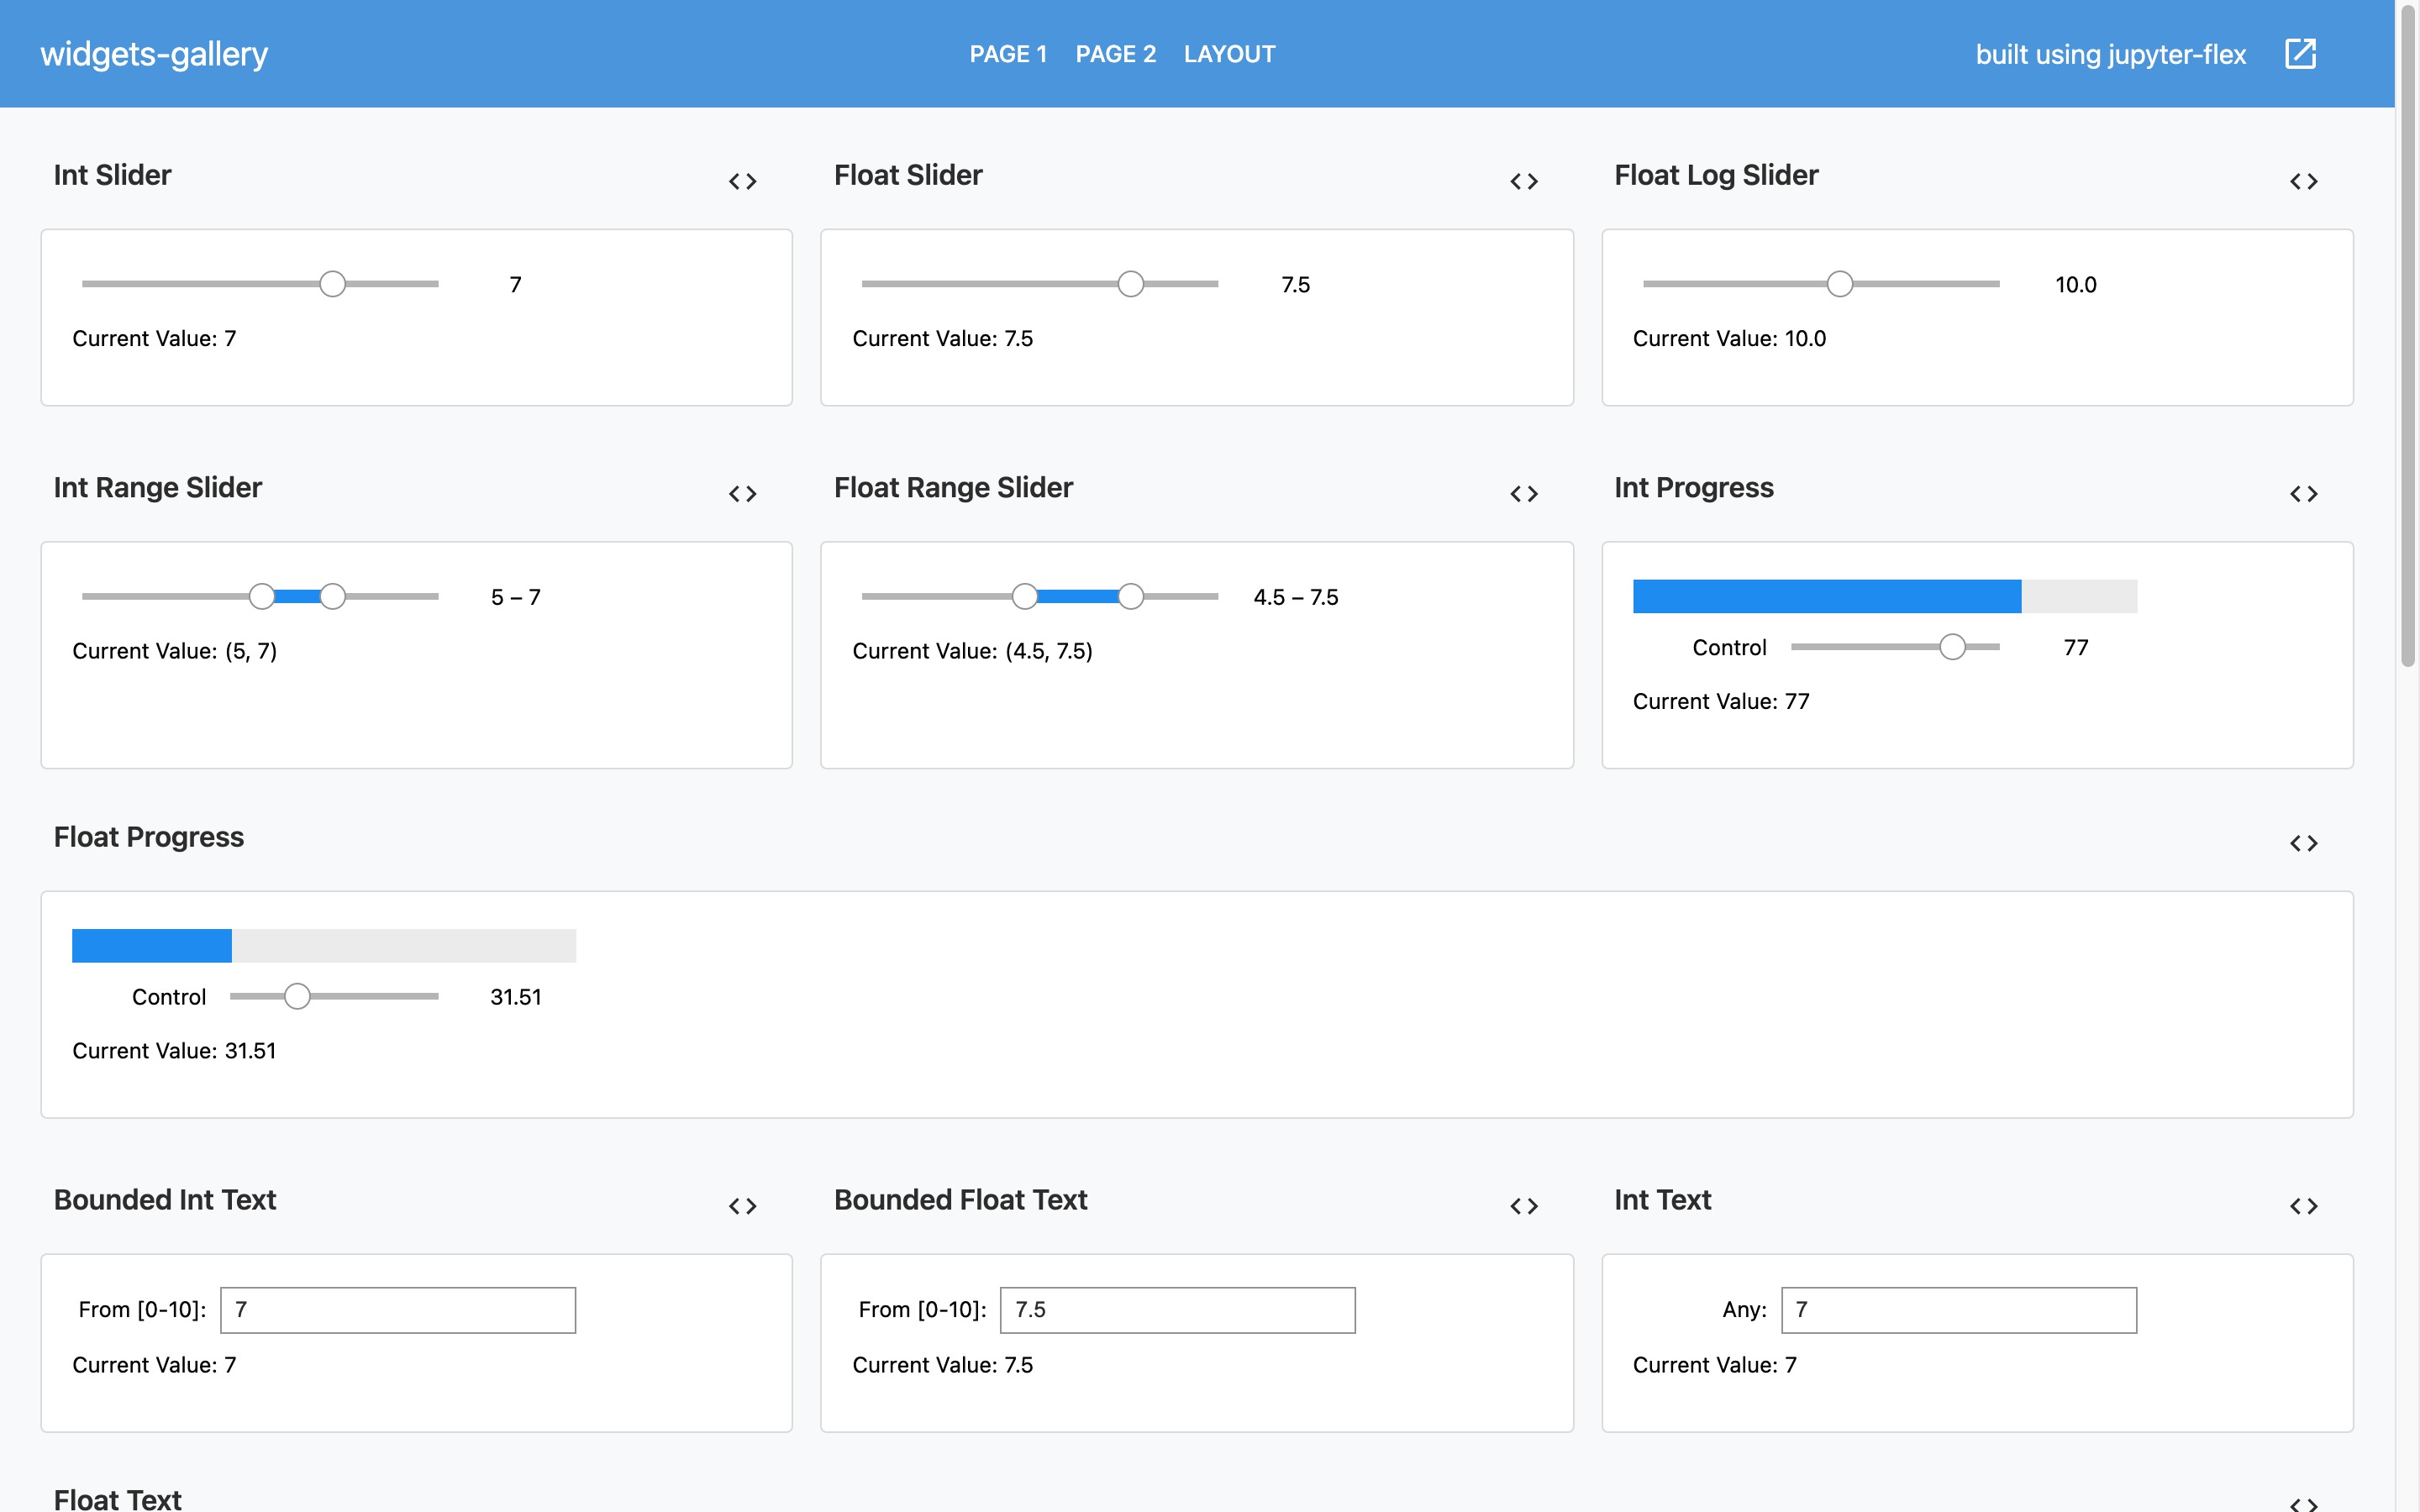
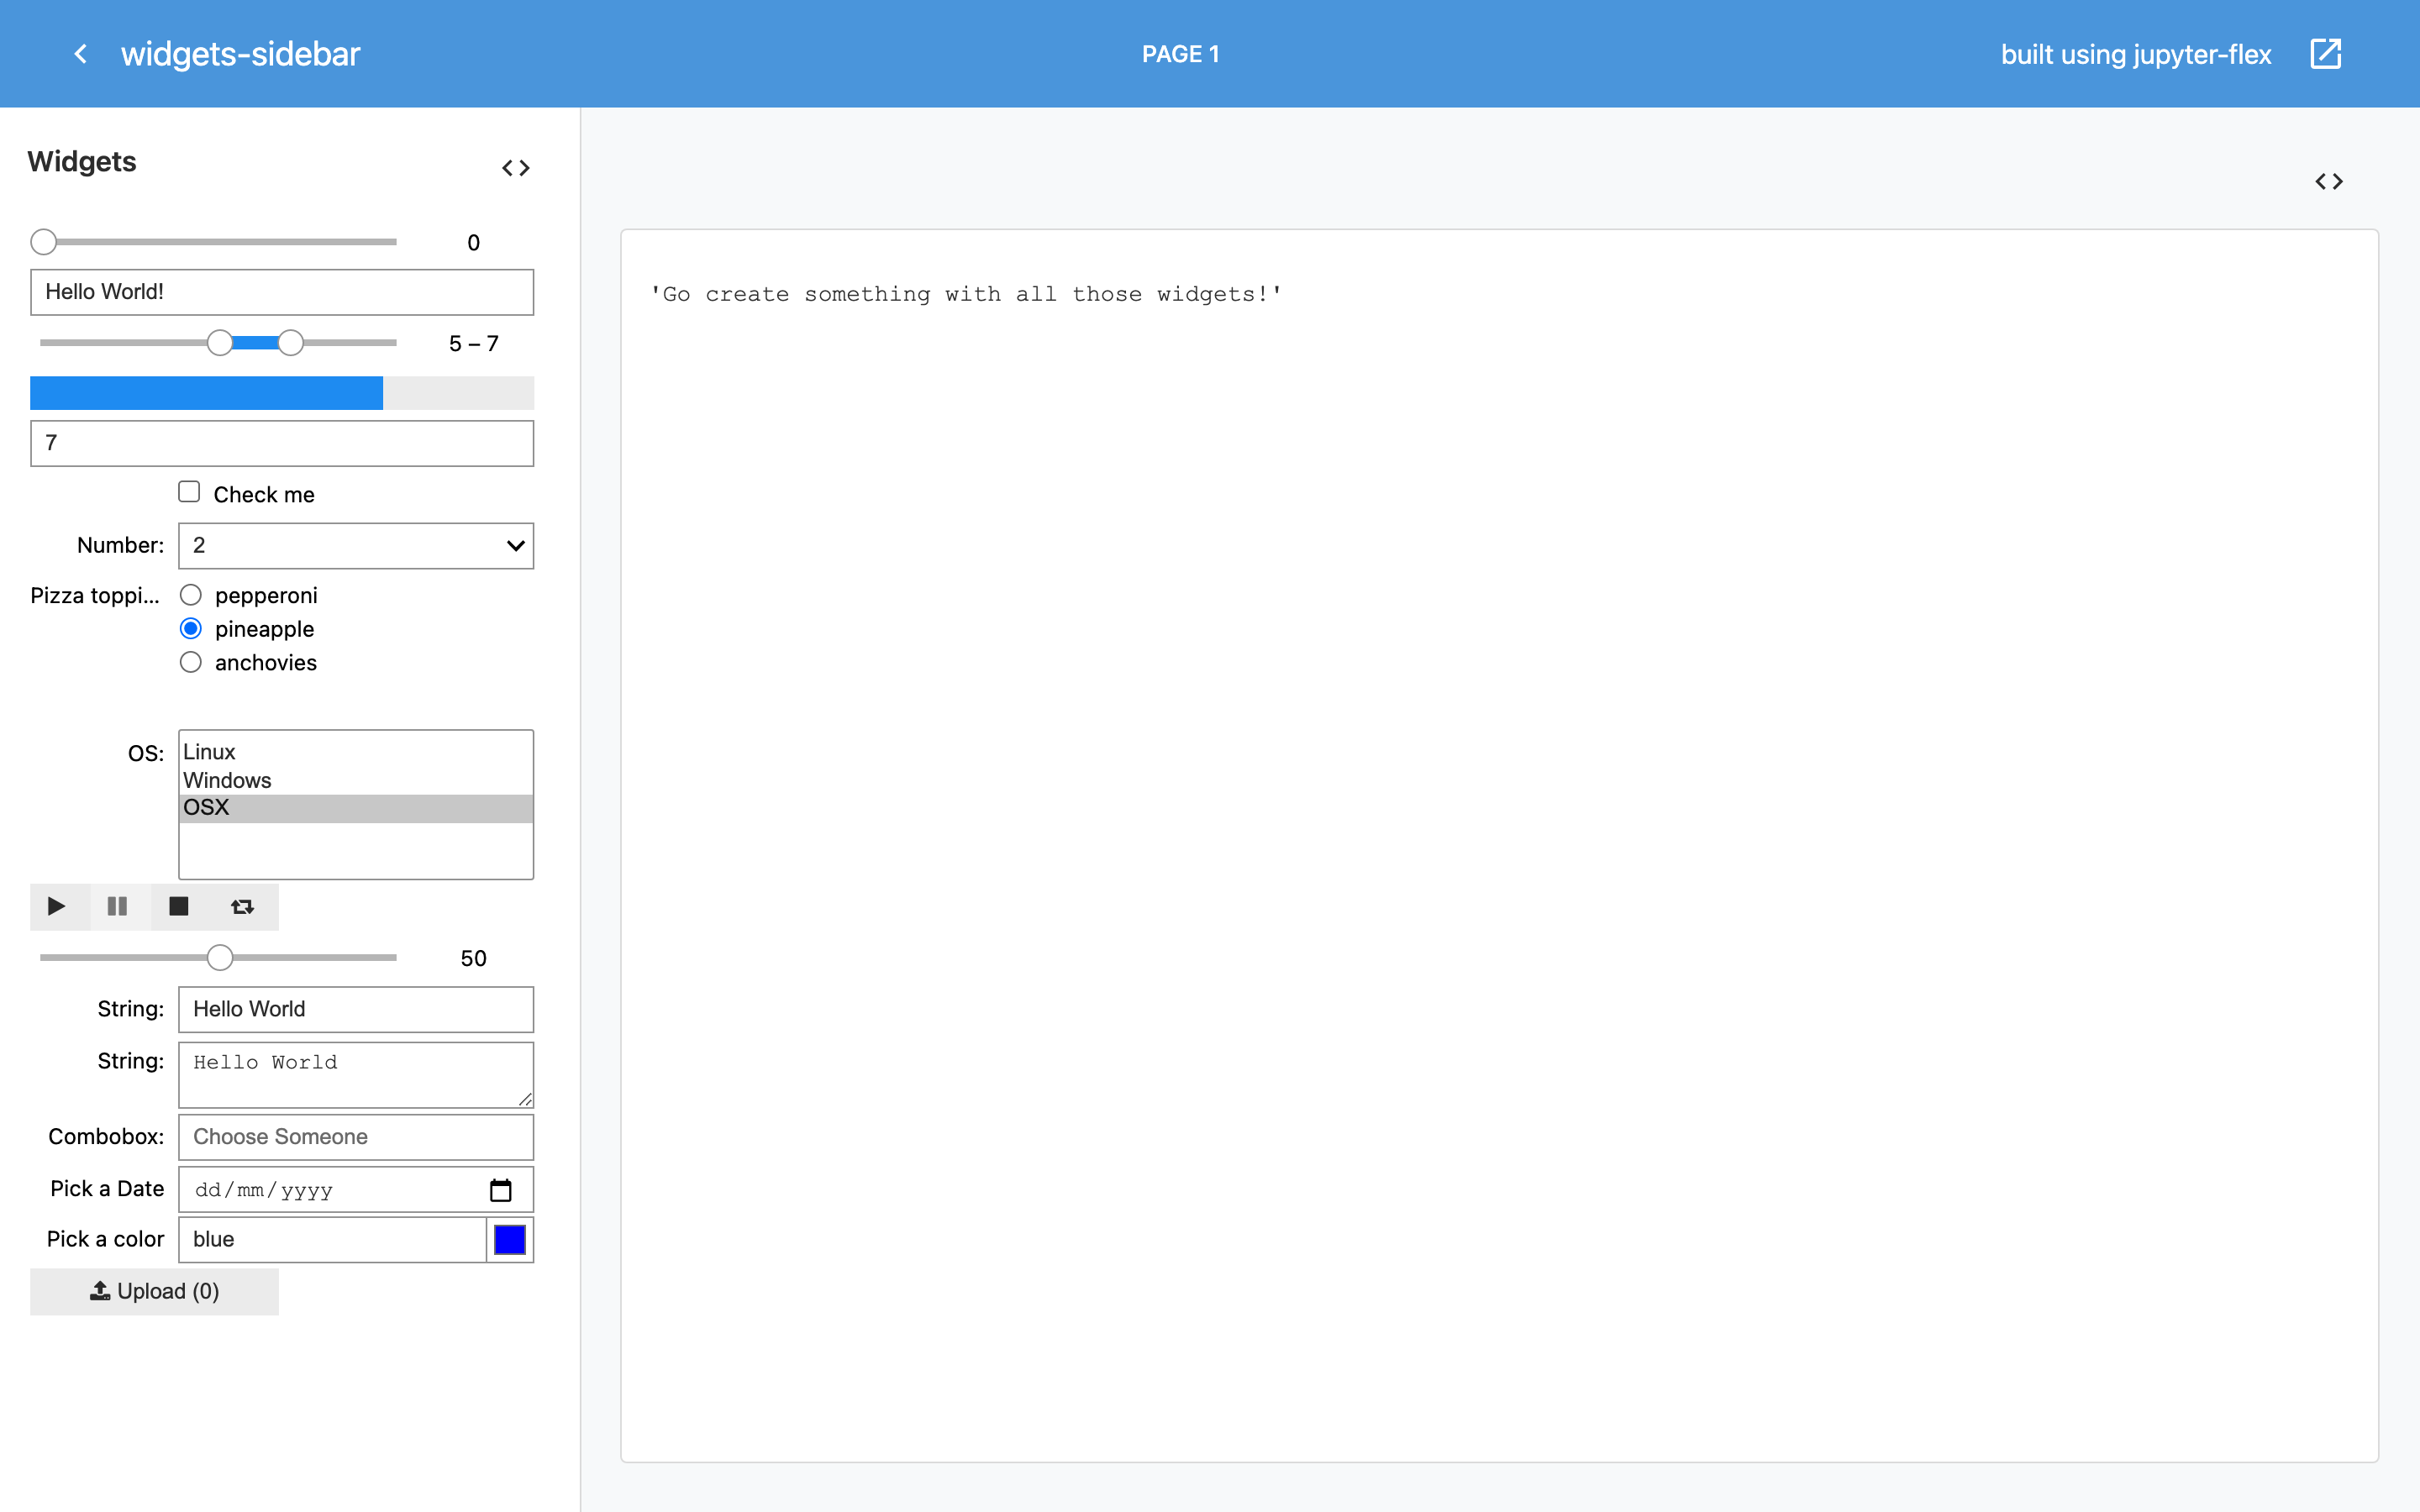
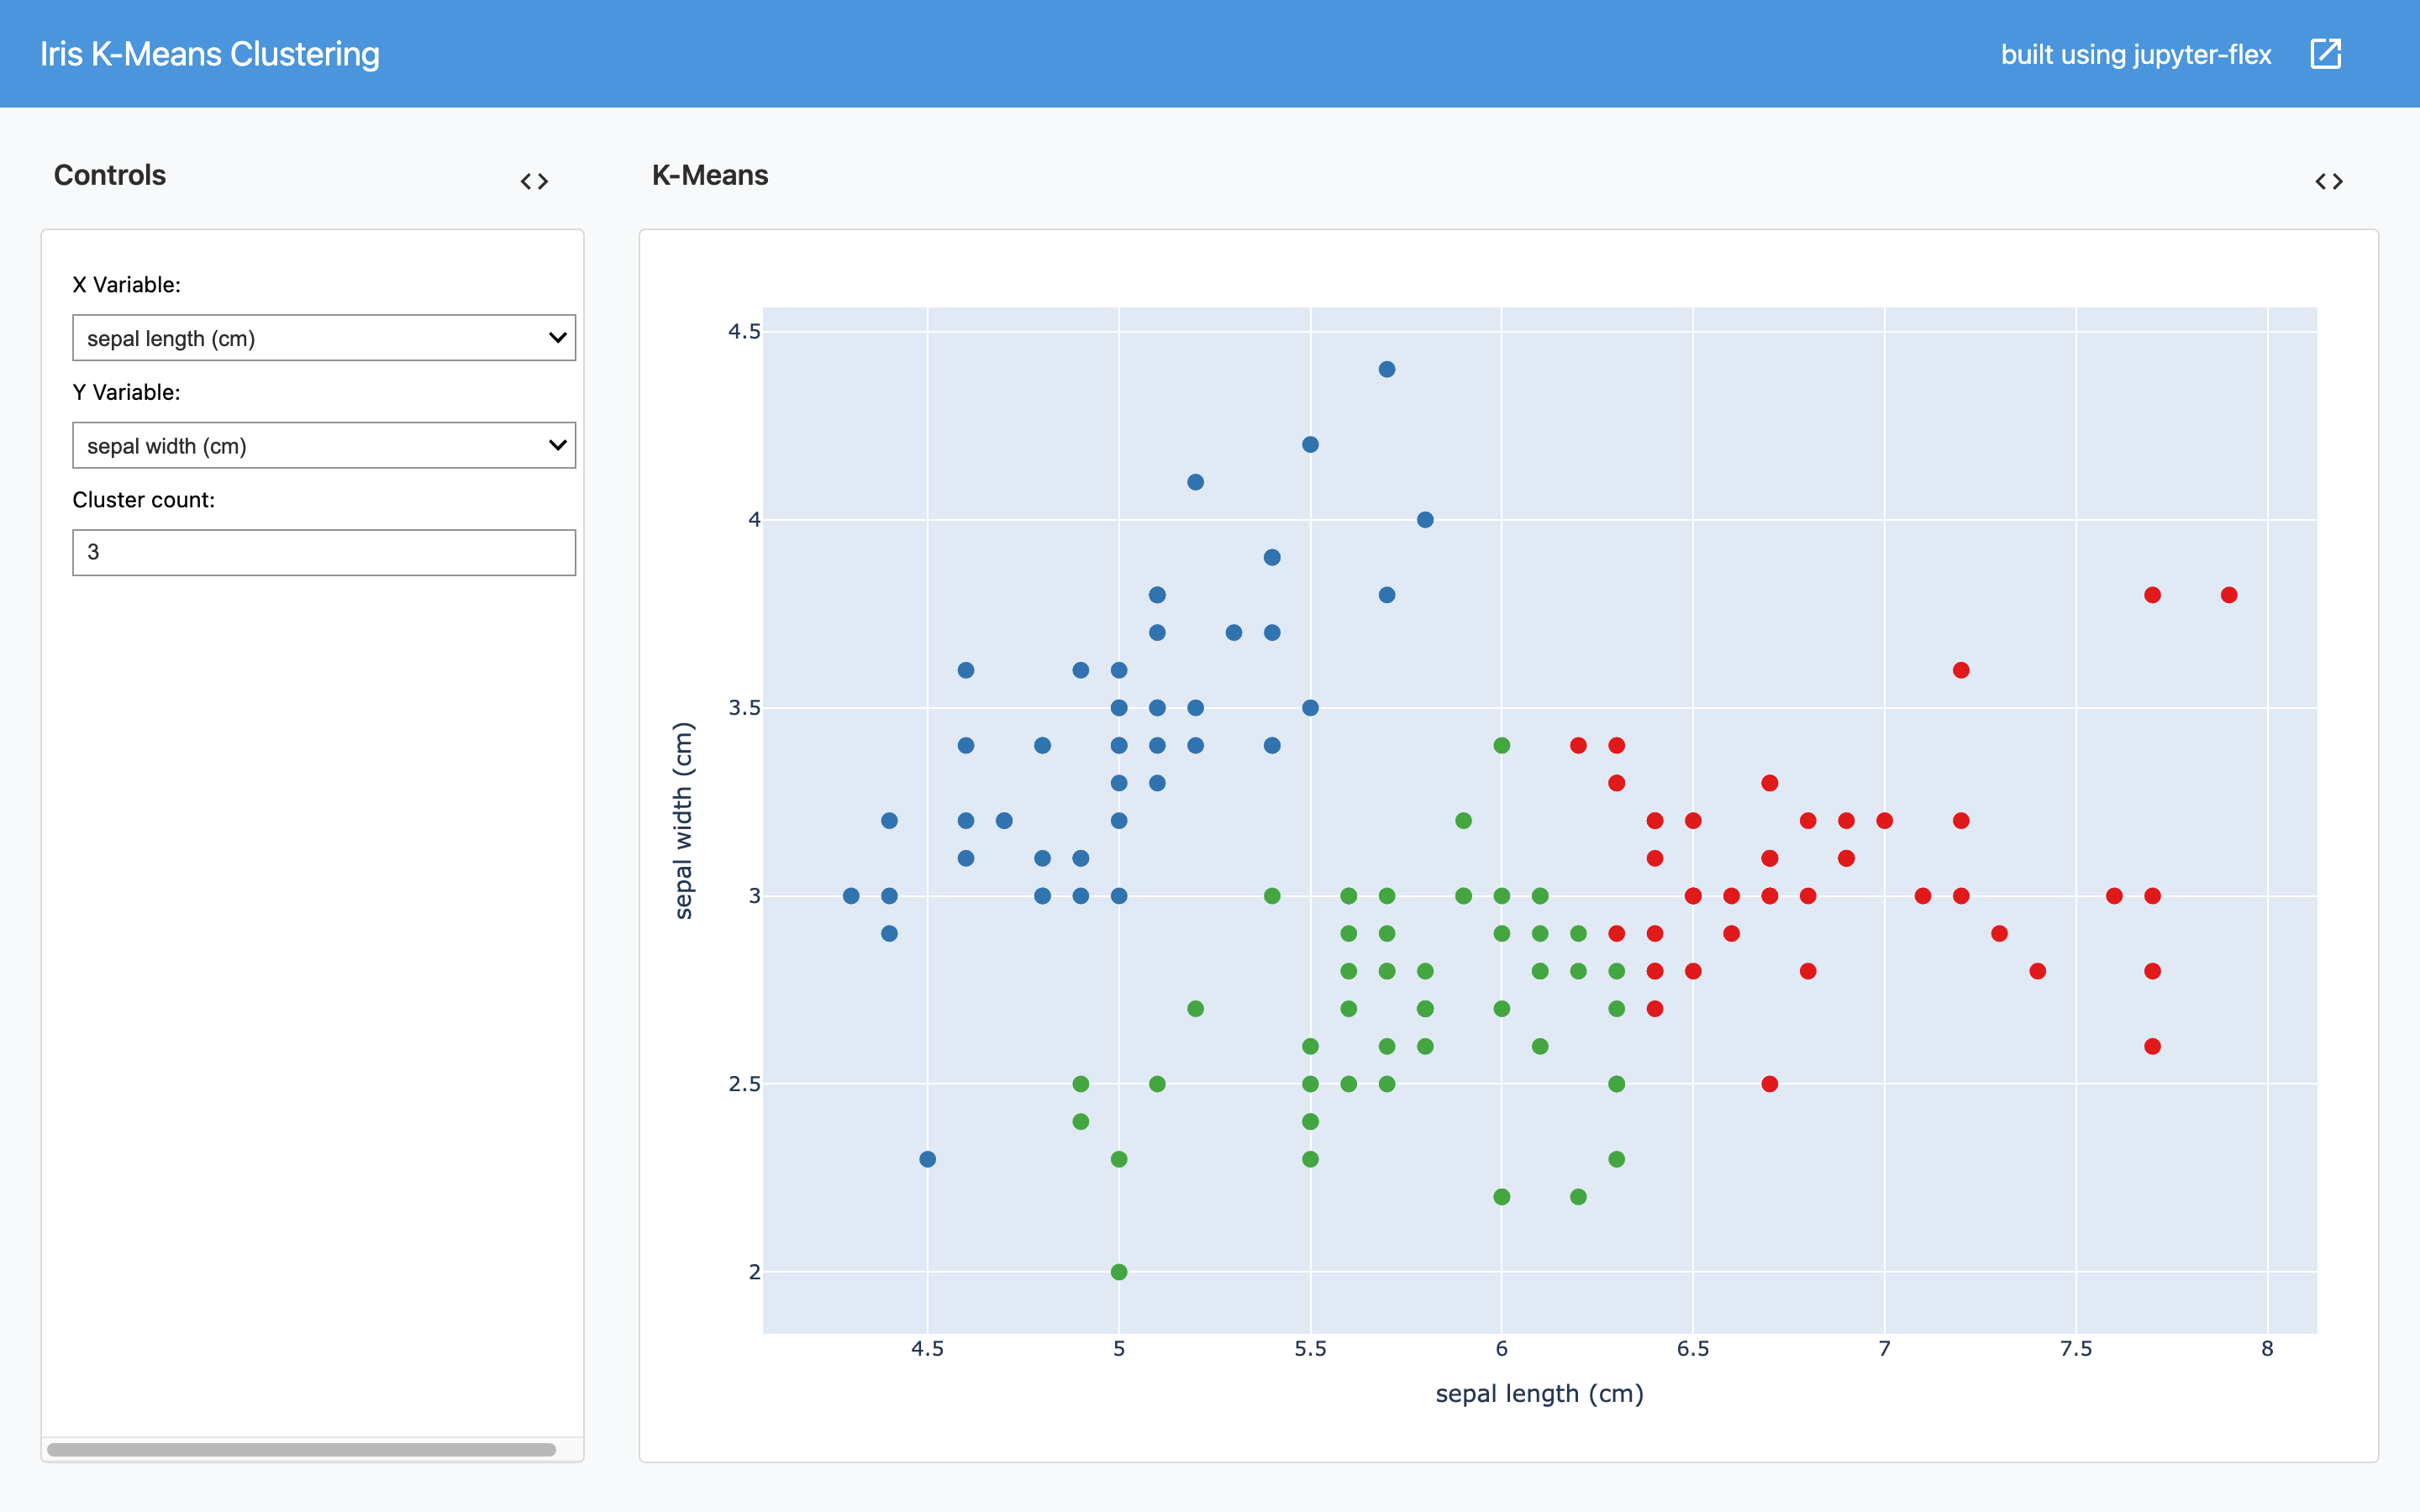
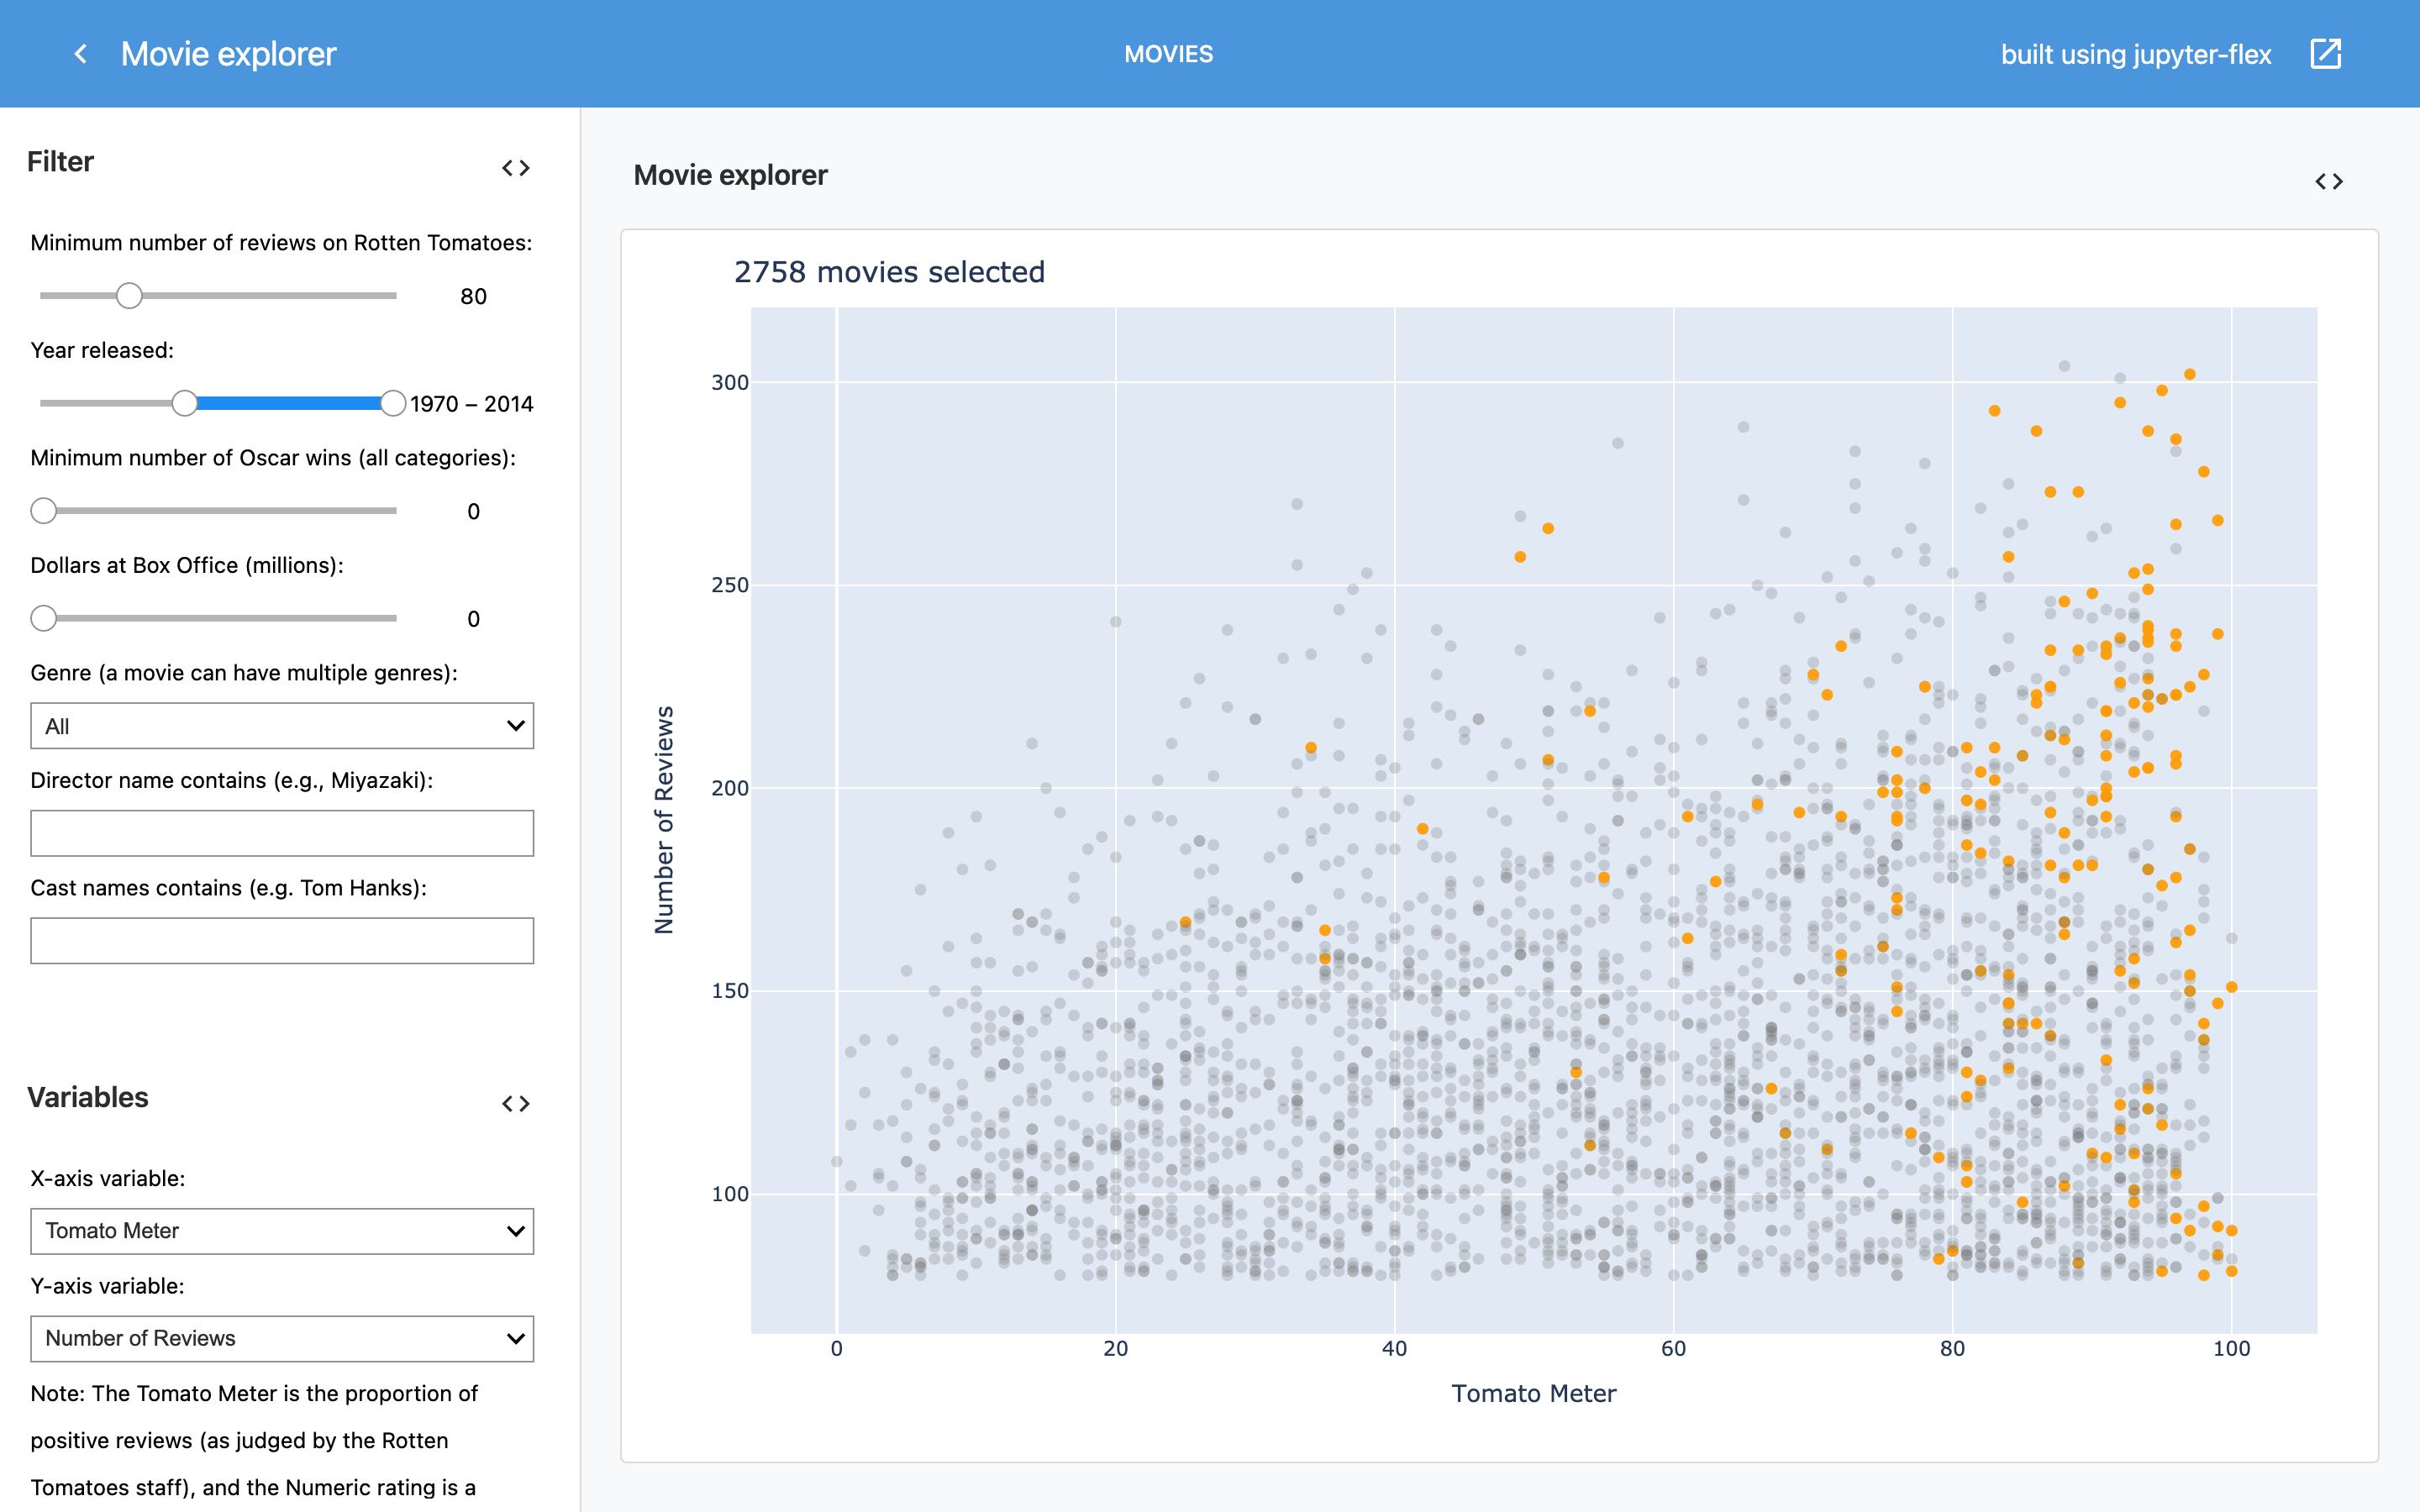
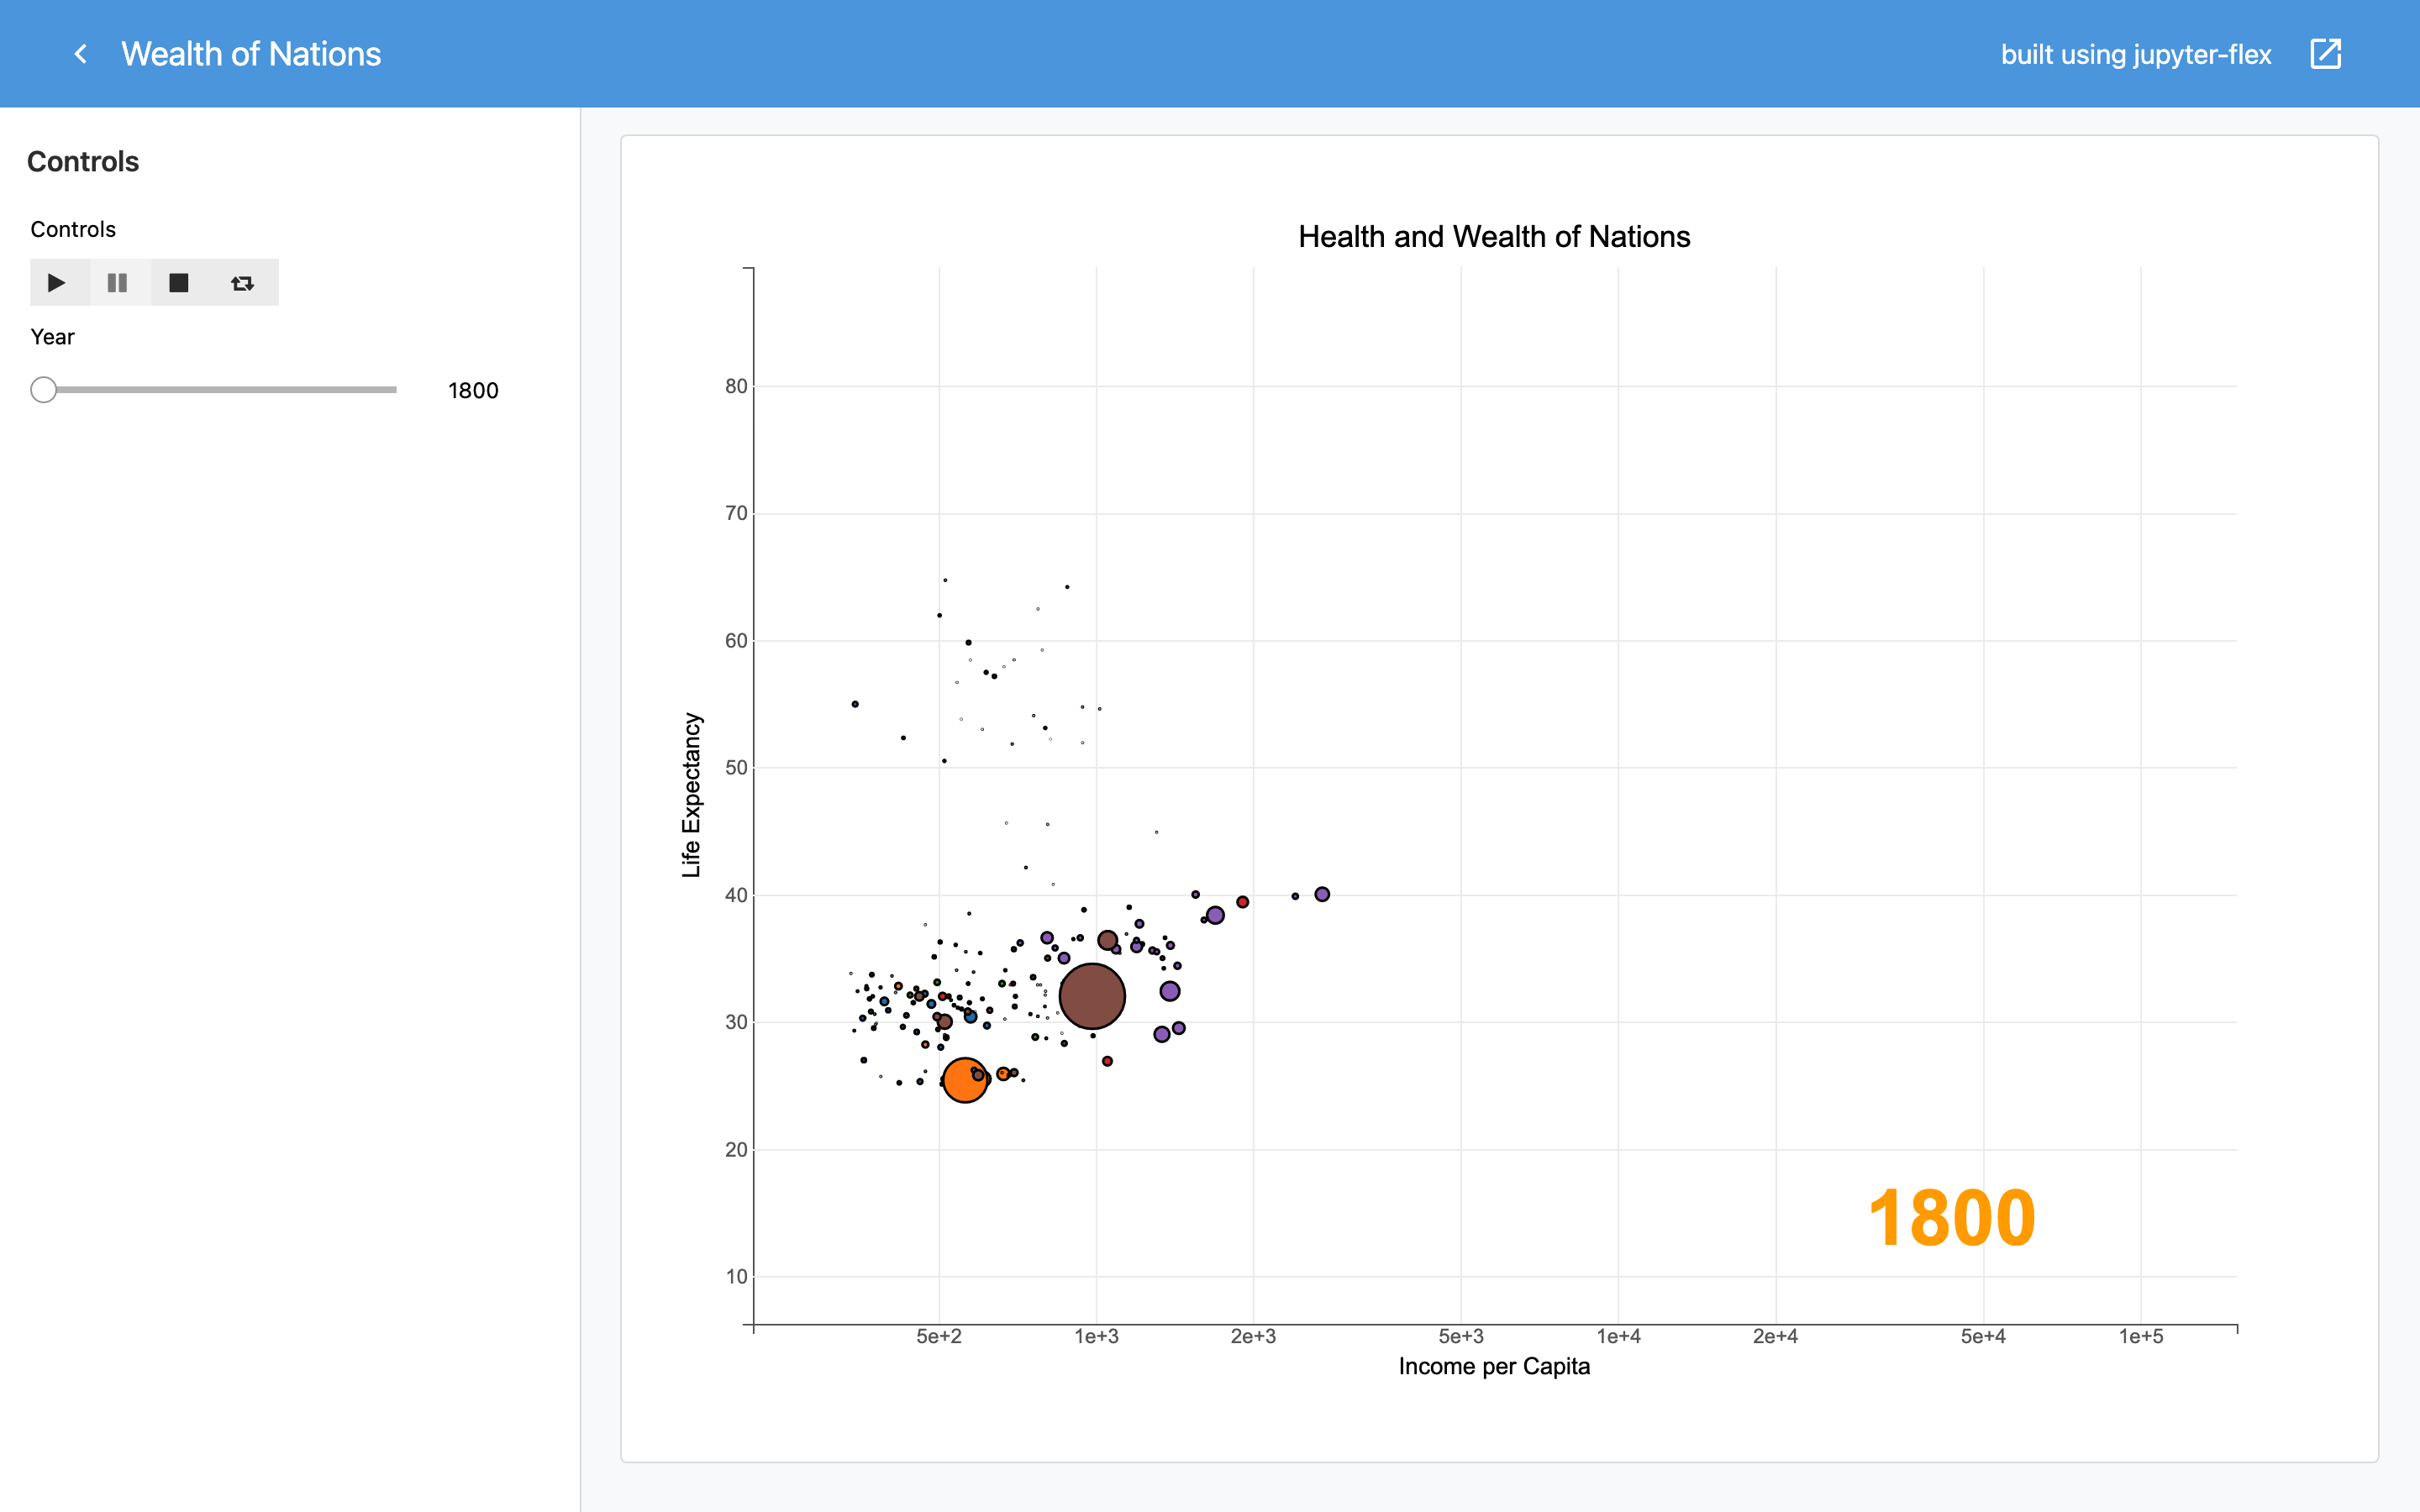
More examples powered by Voila and that use different ipywidgets like bqplot, ipyleaflet.
