Layouts
This page explains the multiple layouts components and all the options to control the layout of the dashboard.
There are 4 main components in a jupyter-flex dashboard in this hierarchy:
- Pages
- Sections
- Cards
- Cells
Meaning that Pages contain one or more Sections, Sections contains one or multiple Cards and Cards contain one or multiple Cells.
Cells are pretty self explanatory as they are the same as in Jupyter, they can be Markdown or Code cells and can contain one output (text or images).
Cards
A Card is an object that holds one or more Cells, these can be markdown cells or code cells that have outputs such as plots, text, widgets and more.
To define a new Card you use a level-3 markdown header (###). Each card belongs in a Section and one Section can have one or more Cards.
Any tagged Cell will be added to the current Card until a new Card, Section or Page is defined.
The components of a Card are:
- Title: Based on the value of level-3 markdown header (
###) used to define it - One (or more) code cells tagged with
bodythat contain outputs - One (or more) markdown cells tagged with
bodythat contain some narrative for the dashboard - Footer: one or more markdown or code cells tagged with
footer - Info dialog: one or more markdown or code cells tagged with
info
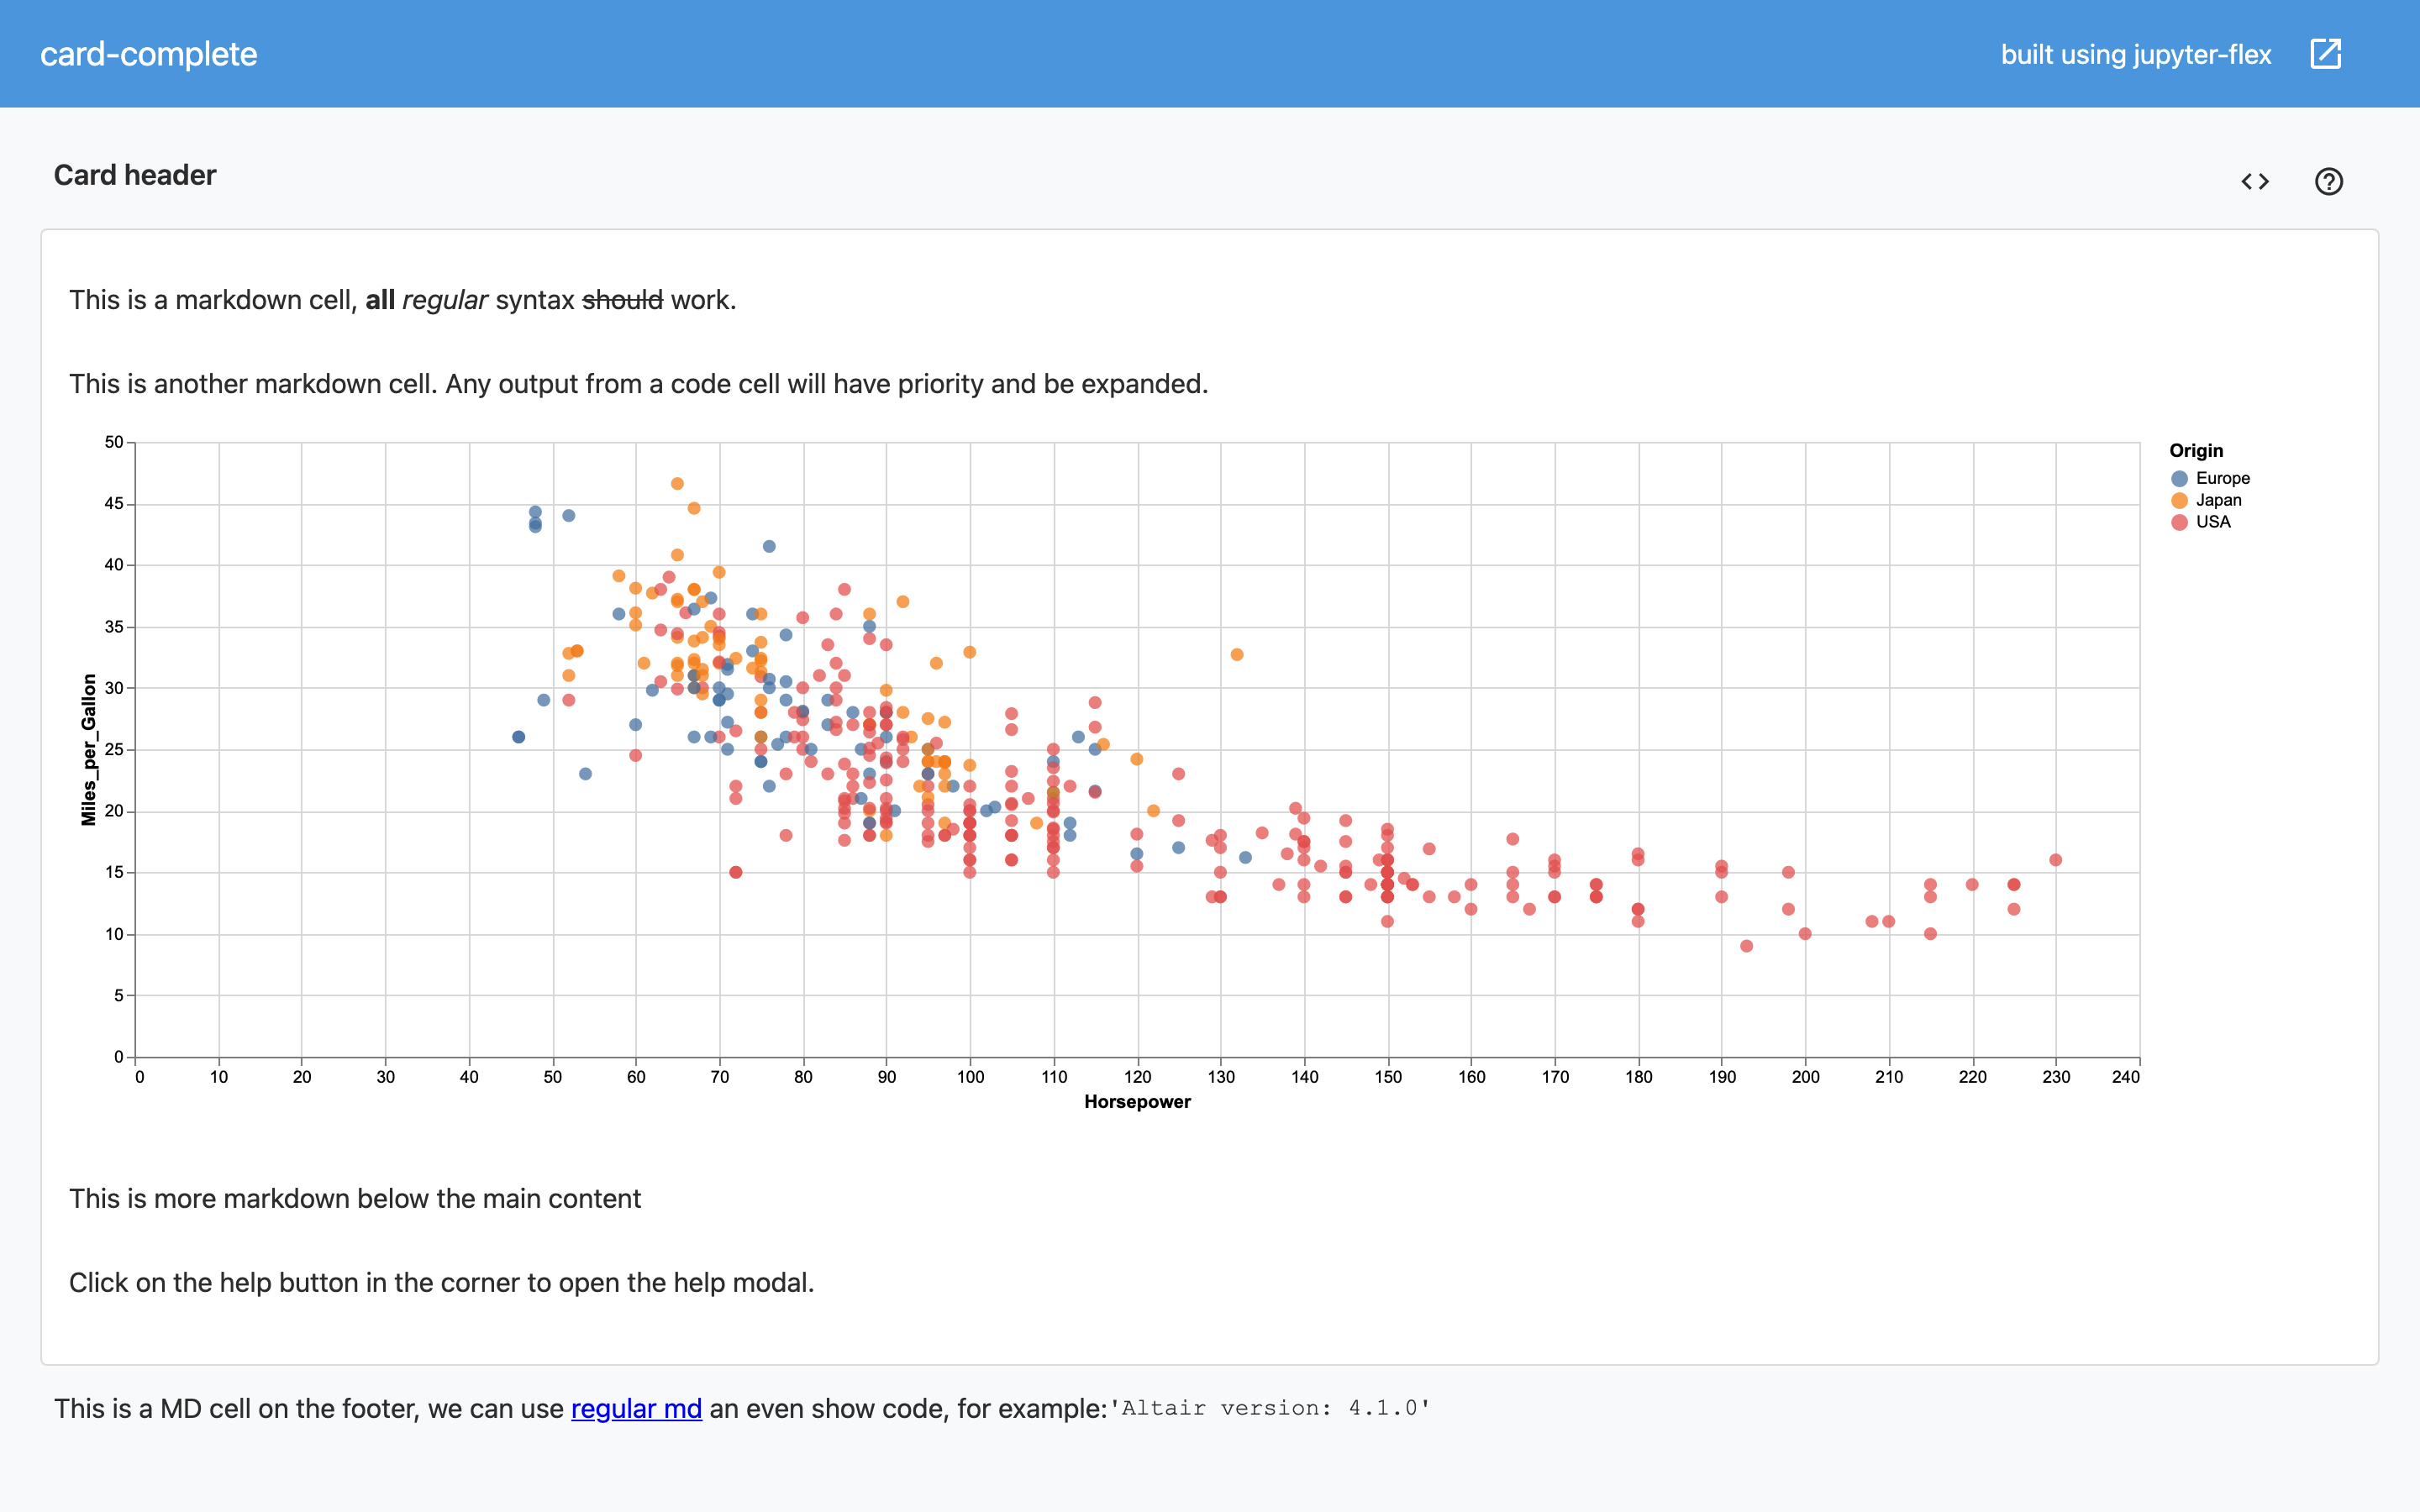
For example take this notebook with one Card, two plots and some text. Note that code cells get expanded to ocupy all the space in the Card while markdown cells get just use the space they need to display its content.
### Card header
# This is a markdown cell, **all** *regular* syntax ~~should~~ work.
# This is another markdown cell. Any output from a code cell will have priority and be expanded.
import altair as alt
from vega_datasets import data
alt.renderers.set_embed_options(actions=False)
RendererRegistry.enable('default')
source = data.cars()

plot = alt.Chart(source).mark_circle(size=60).encode(
    x='Horsepower',
    y='Miles_per_Gallon',
    color='Origin',
    tooltip=['Name', 'Origin', 'Horsepower', 'Miles_per_Gallon']
)
plot
plot.properties(
    width='container',
    height='container'
)
This is more markdown below the main content
Click on the help button in the corner to open the help modal.
This is the help modal, the title above ^^ is the same card header and this is just a regular markdown cell.
"This is code output"
'This is code output'
You can have also have plots here
plot
Click on the image to open dashboard
Sections
A Section is an object that holds one or more Cards, those Cards can be arrangend as rows (default) or columns inside the Section.
To define a new Section you use a level-2 markdown header (##). Each Section belongs in a Page and one Page can have one or more Sections.
The default orientation of Sections in a Page is to show each section as a column.
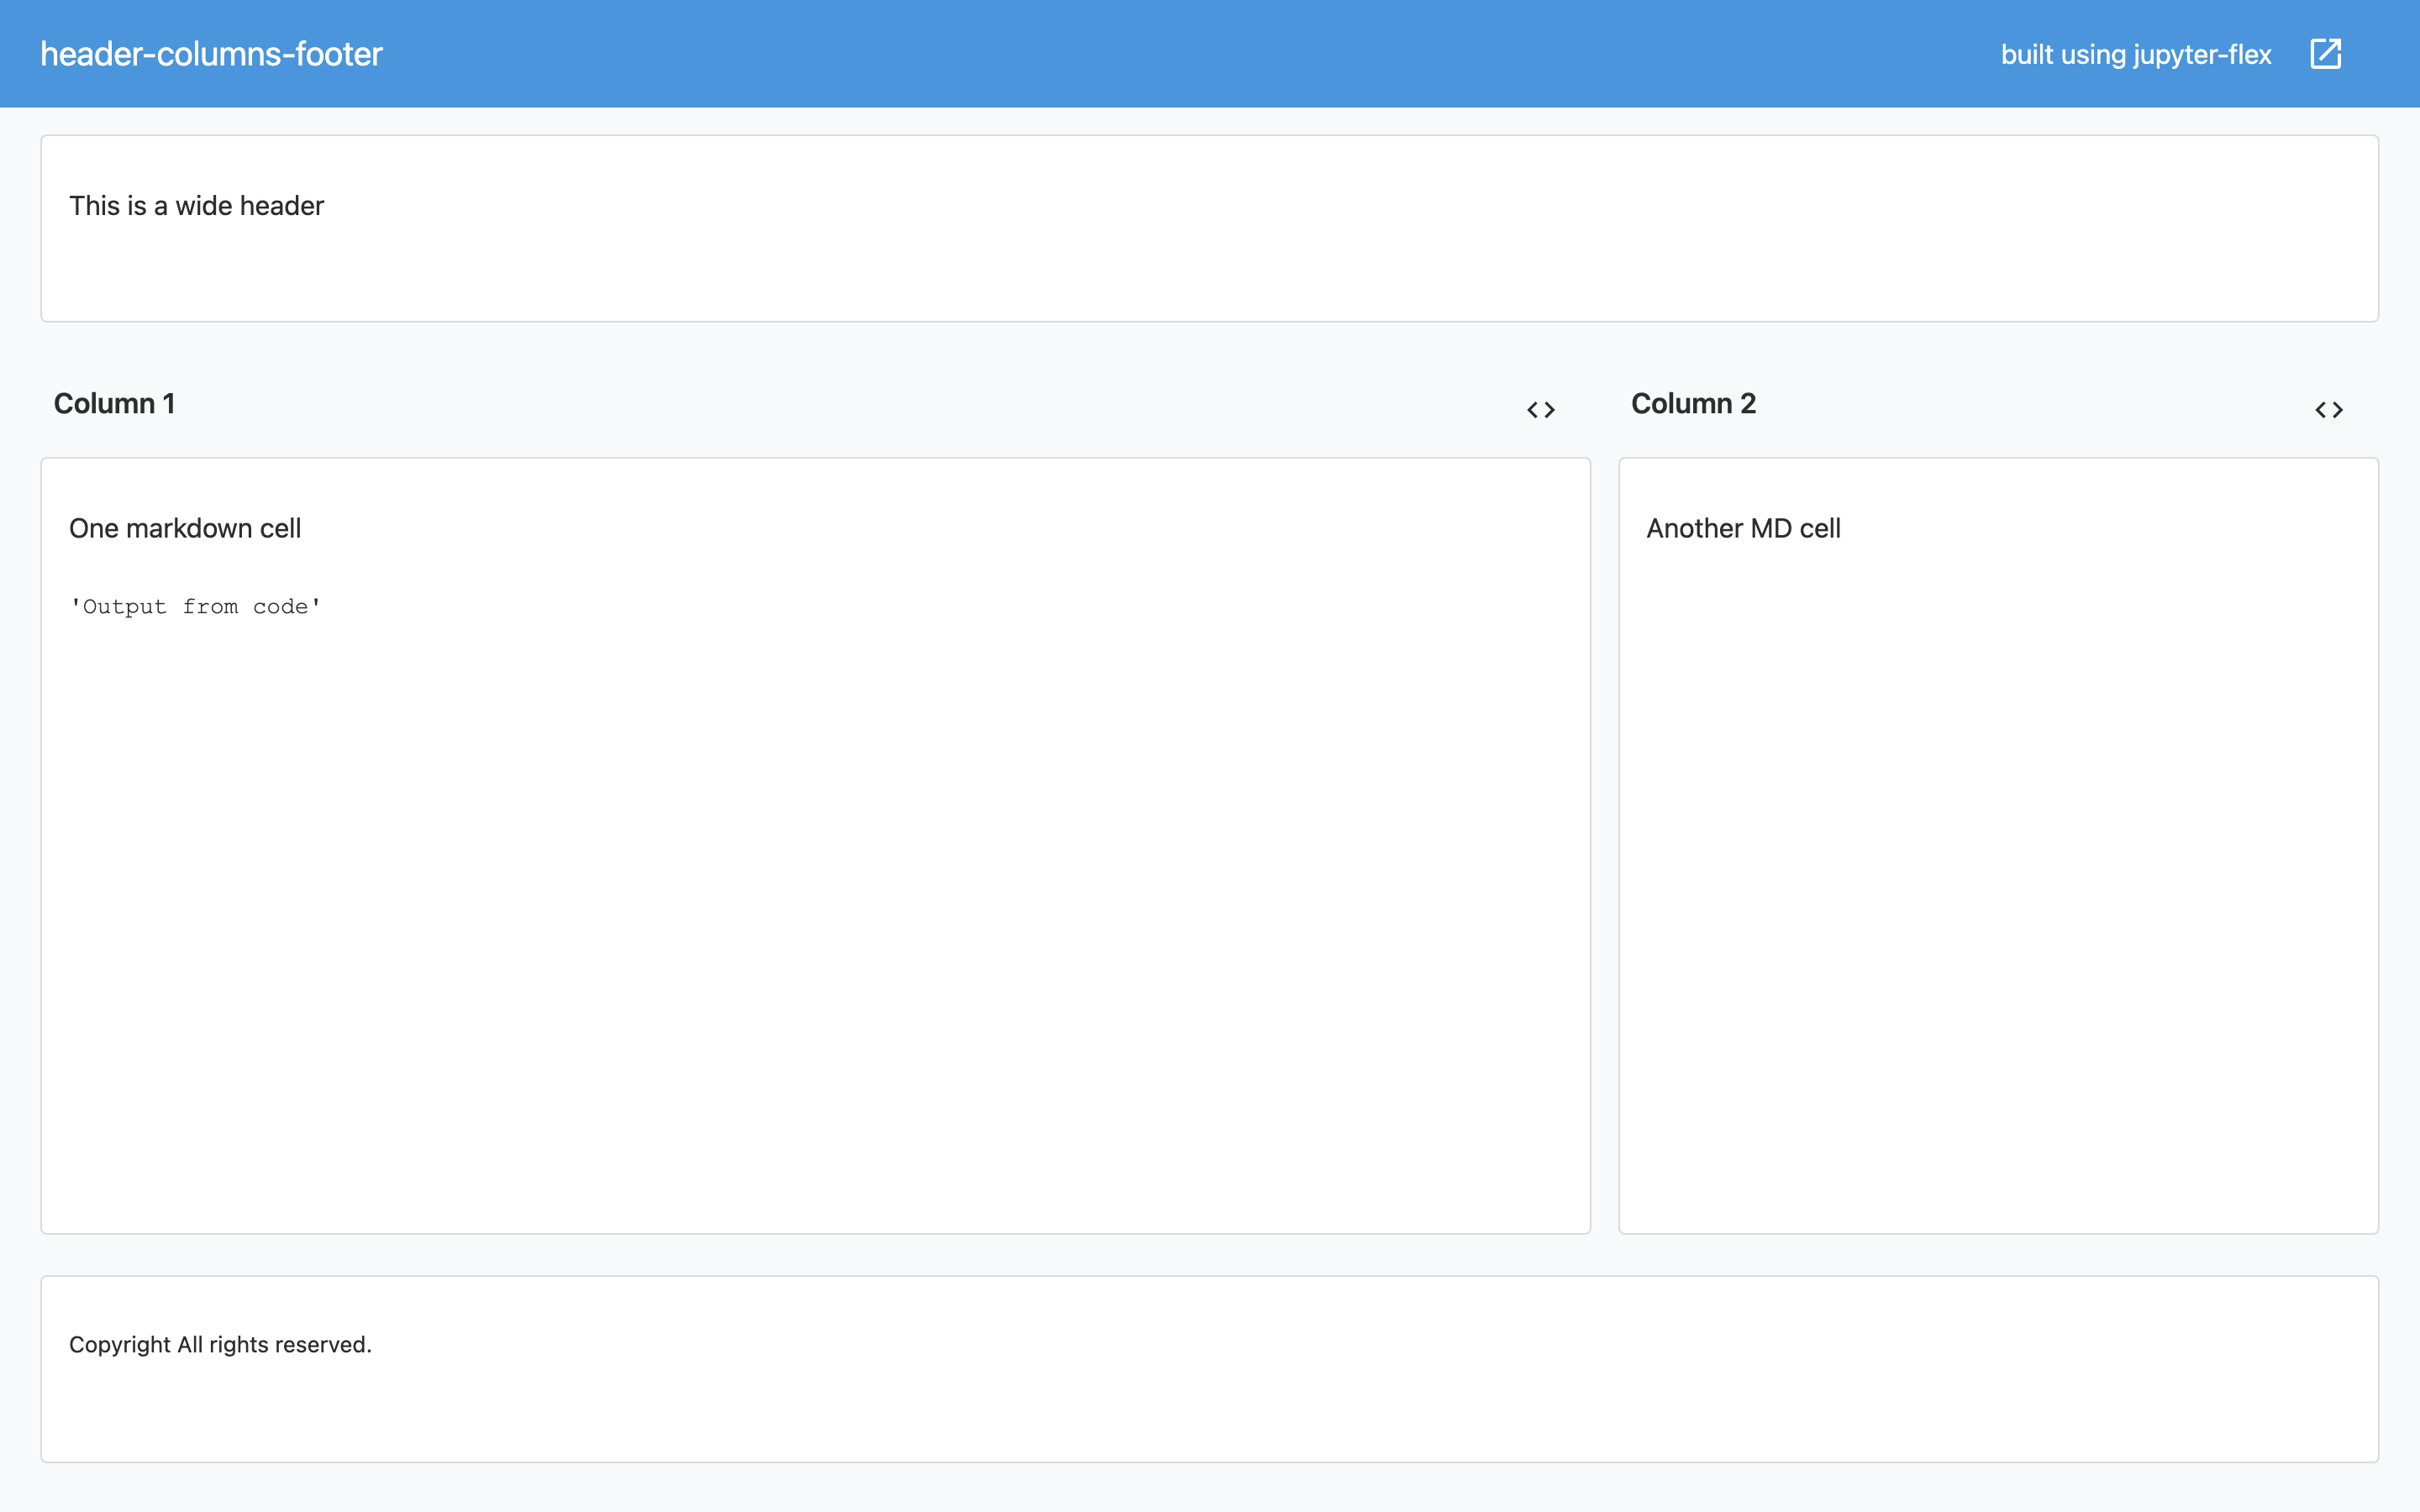
For example take this Notebook with two Sections, the first with one Card and the second one with two:
## Column 1
### Column 1
# <code>
## Column 2
### Column 2 - Row 1
# <code>
### Column 2 - Row 2
# <code>

Click on the image to open dashboard
Orientation
The default orientation for Sections is columns and for Cards is rows. This means that each Section will be shown as one column in a Page and each Card in a Section will be shown as a row.
Each Section default parameters can be overwritten by adding tags to the Section markdown cell (the one with a level-2 header: ##).
For example in the last Notebook to make the second Section (right column) to also be divided by colums, instead of the defualt of rows, we add an orientation=columns tag like this:
## Column 2
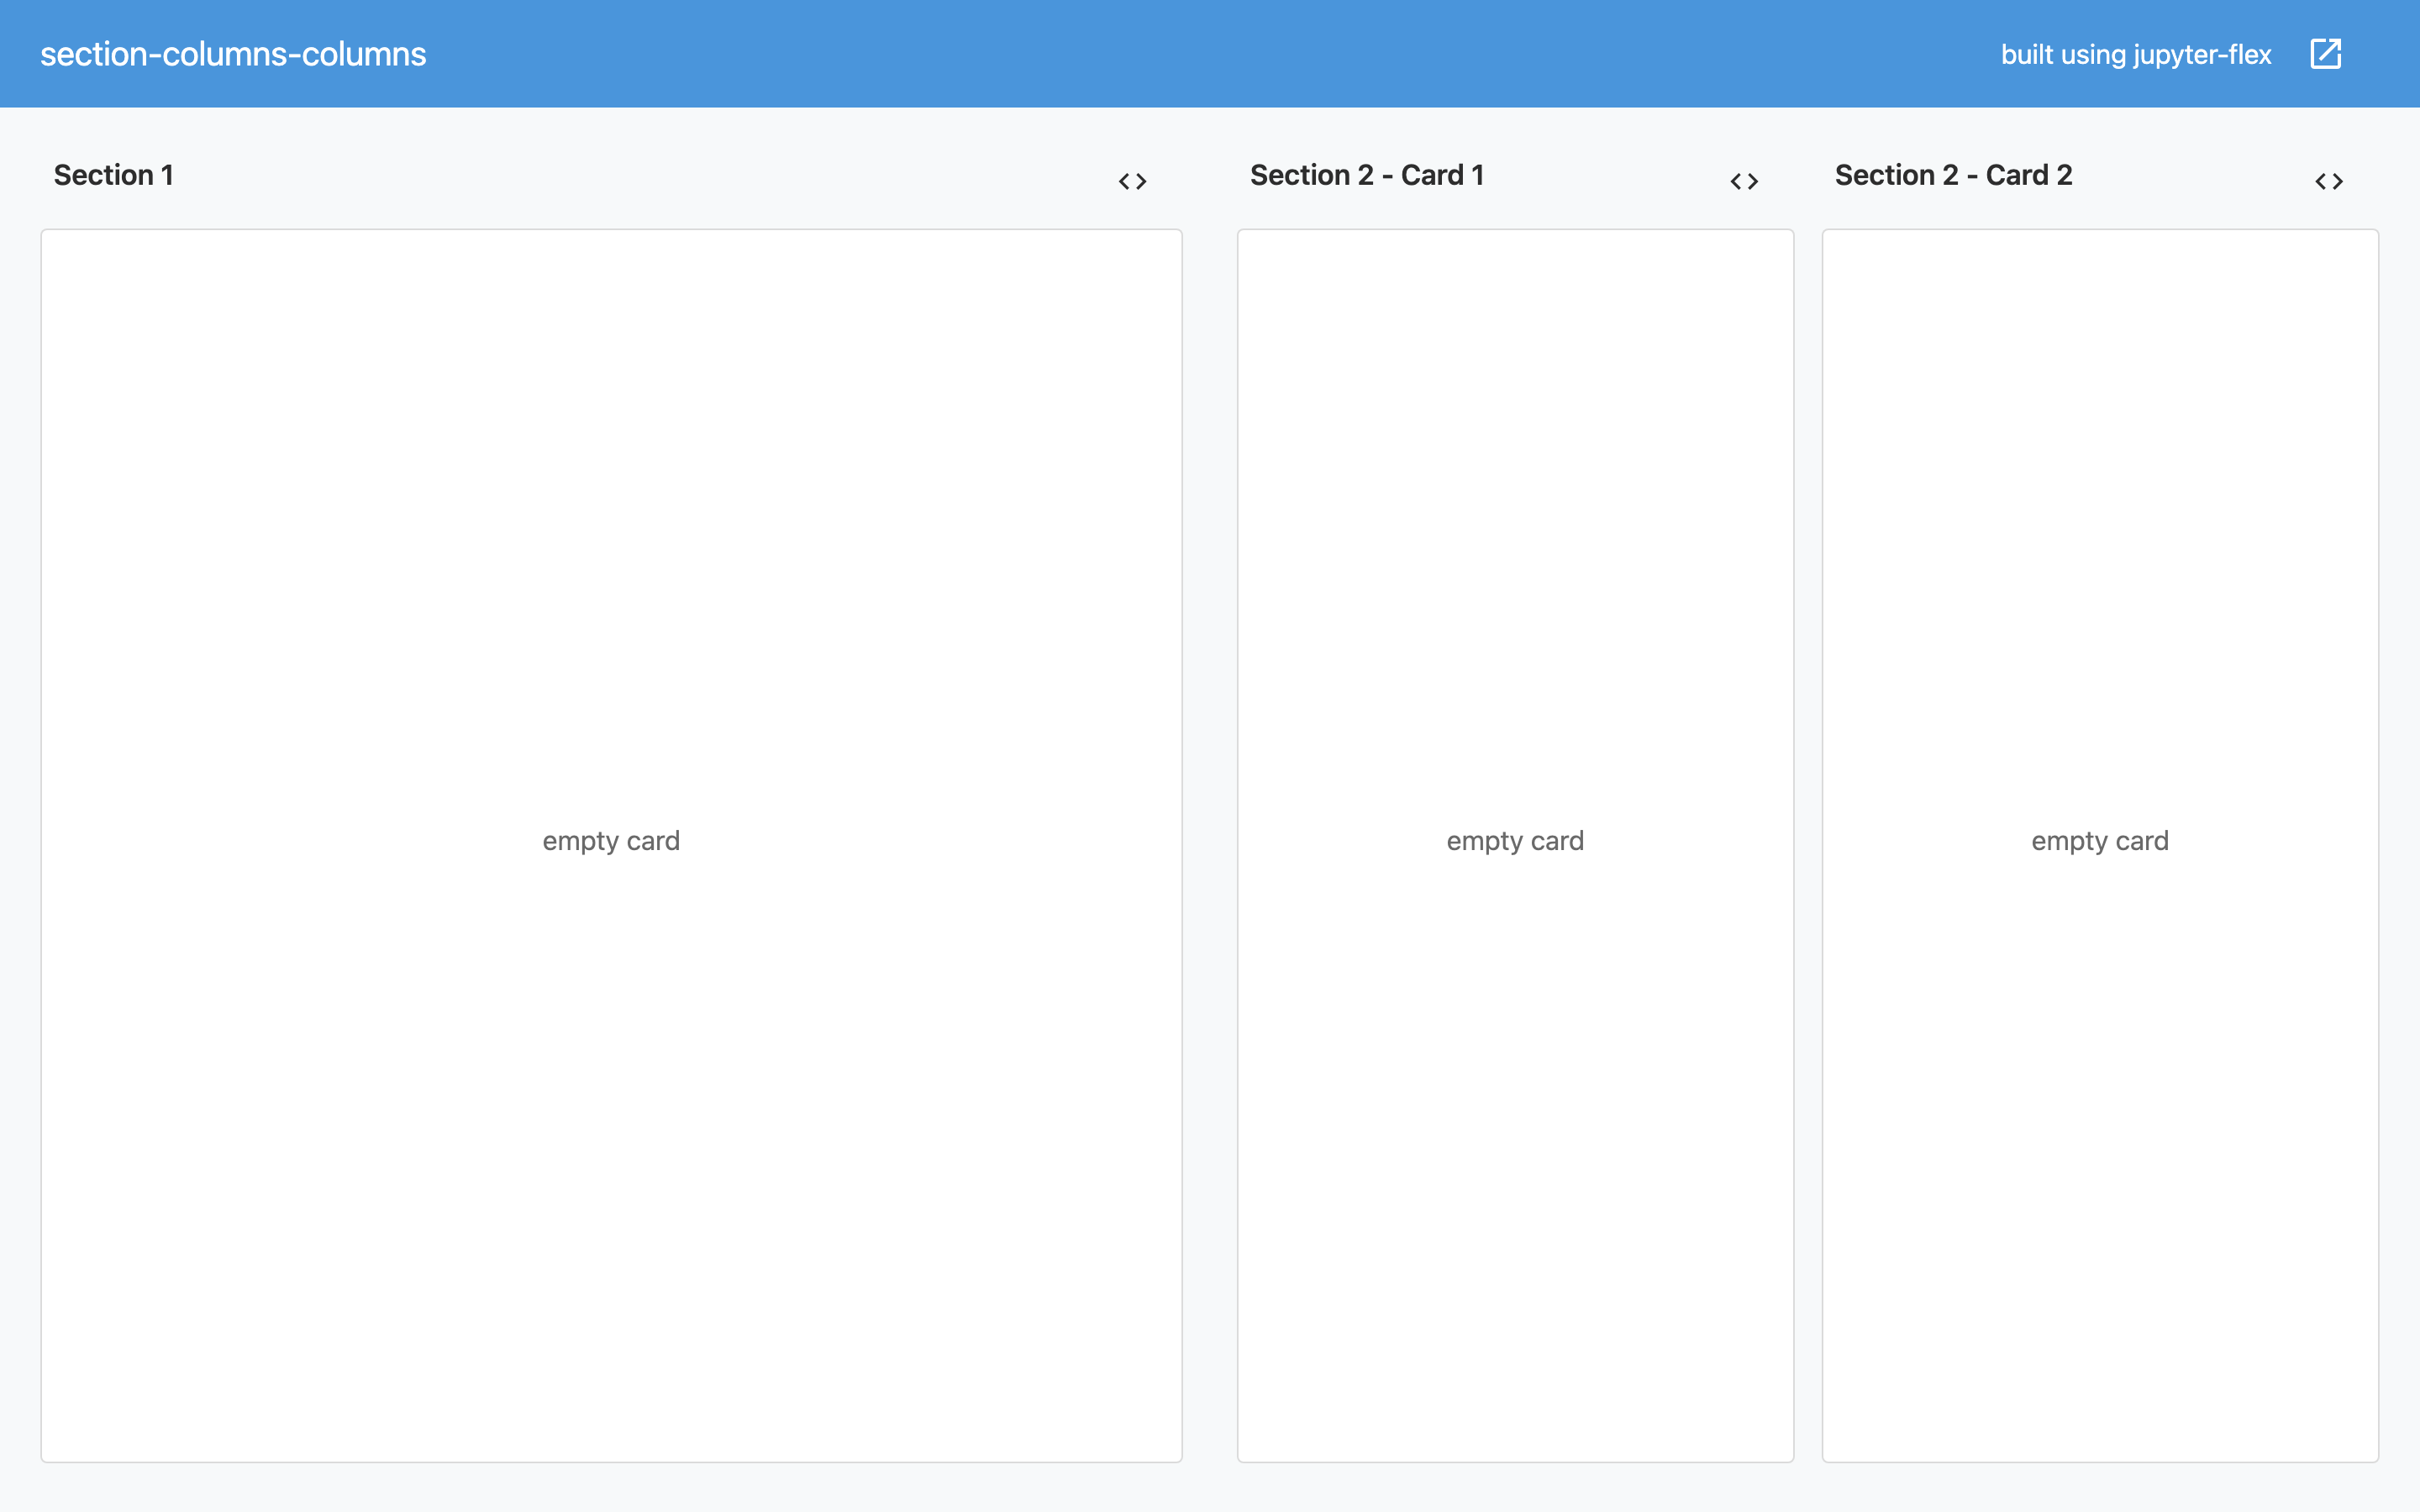
Click on the image to open dashboard
To change the orientation of Sections in a Page use the global flex_orientation parameter.
The default is to use the oposite orientation between Sections and Cards as follows:
- If dashboard
flex_orientationiscolumns(default), then section orientation will default torows - If dashboard
flex_orientationisrows, then section orientation well default tocolumns
To set the global parameters you tag one code Cell in the Notebook with parameters.
The parameters tag
- It's usually a good idea to have this cell at the begining of the notebook
- This is the same tag used by papermill so you can use it as part of a pipeline
For example adding the following cell as the first cell of the Notebook we had before:
flex_orientation = "rows"
Click on the image to open dashboard
Size: Width and Height
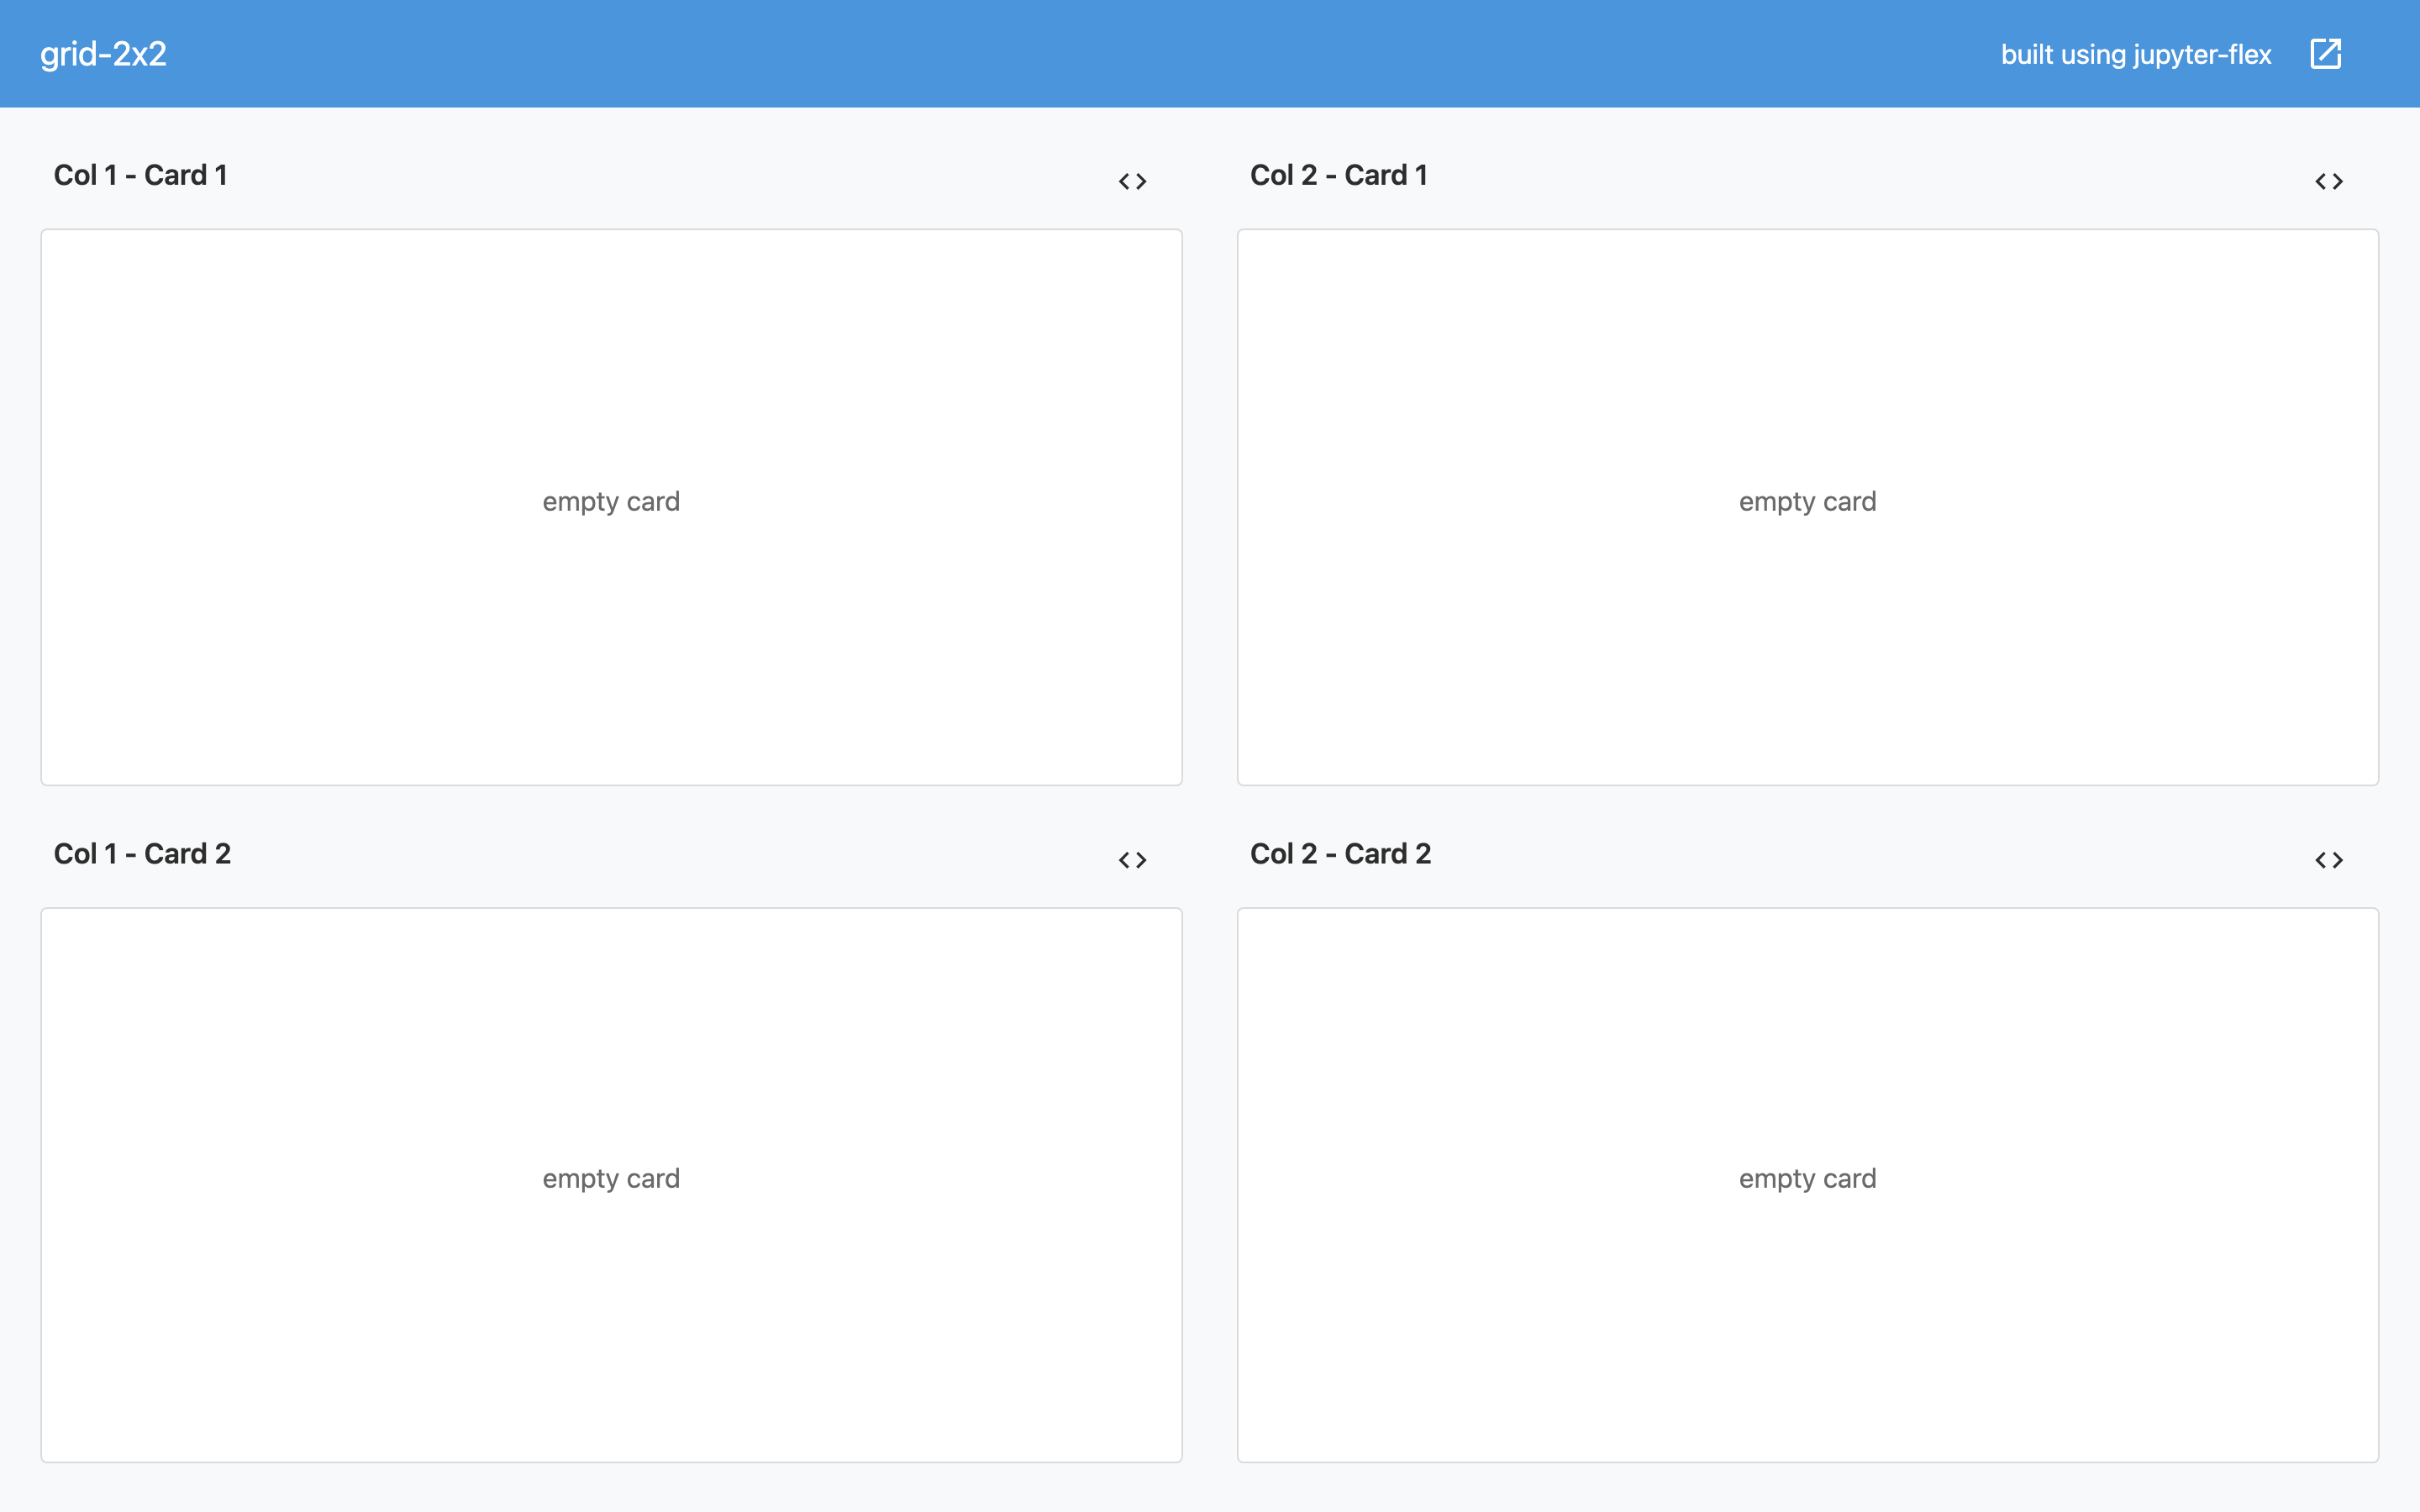
You might have noticed that by default all the Cards and Section space is divided equally. If there are 2 Cards in a Section each Card will get 50% of the space, if there are 3 Cards in one Section each will get 33.3% of the space and so on and the same applies for multiple Sections in one Page.
These proportions can be controlled using the size={value} tag in Sections and Cards cells.
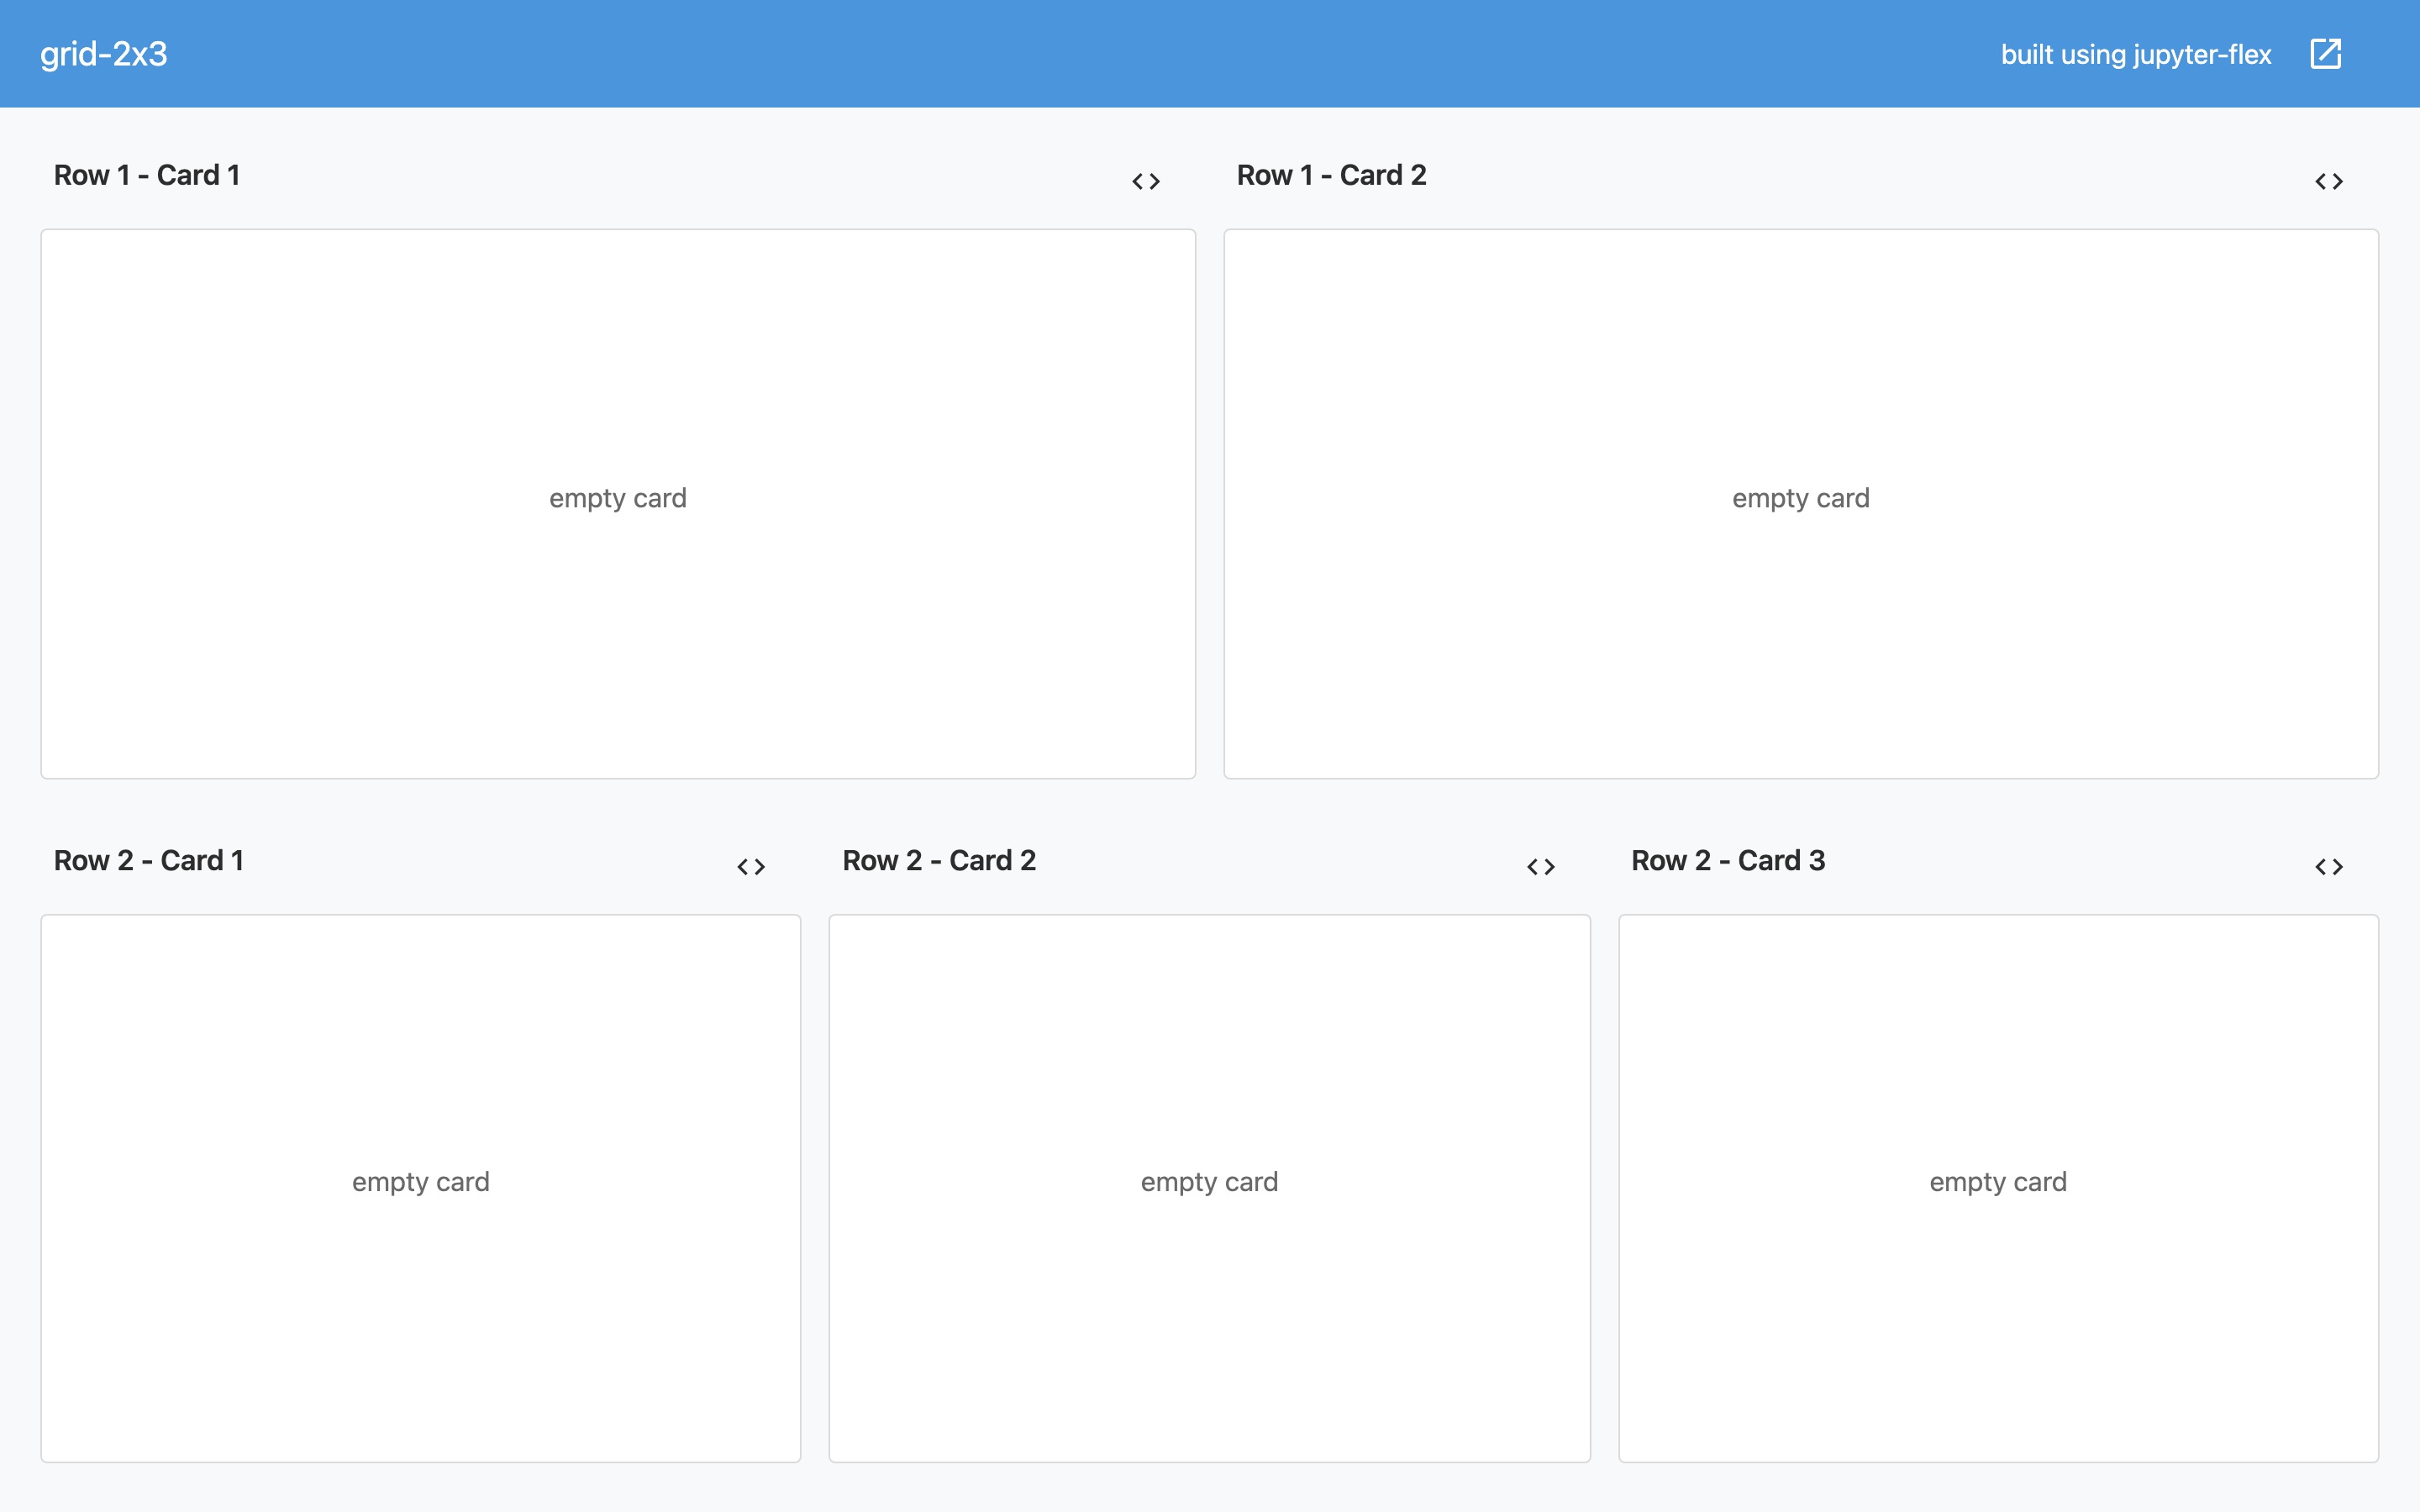
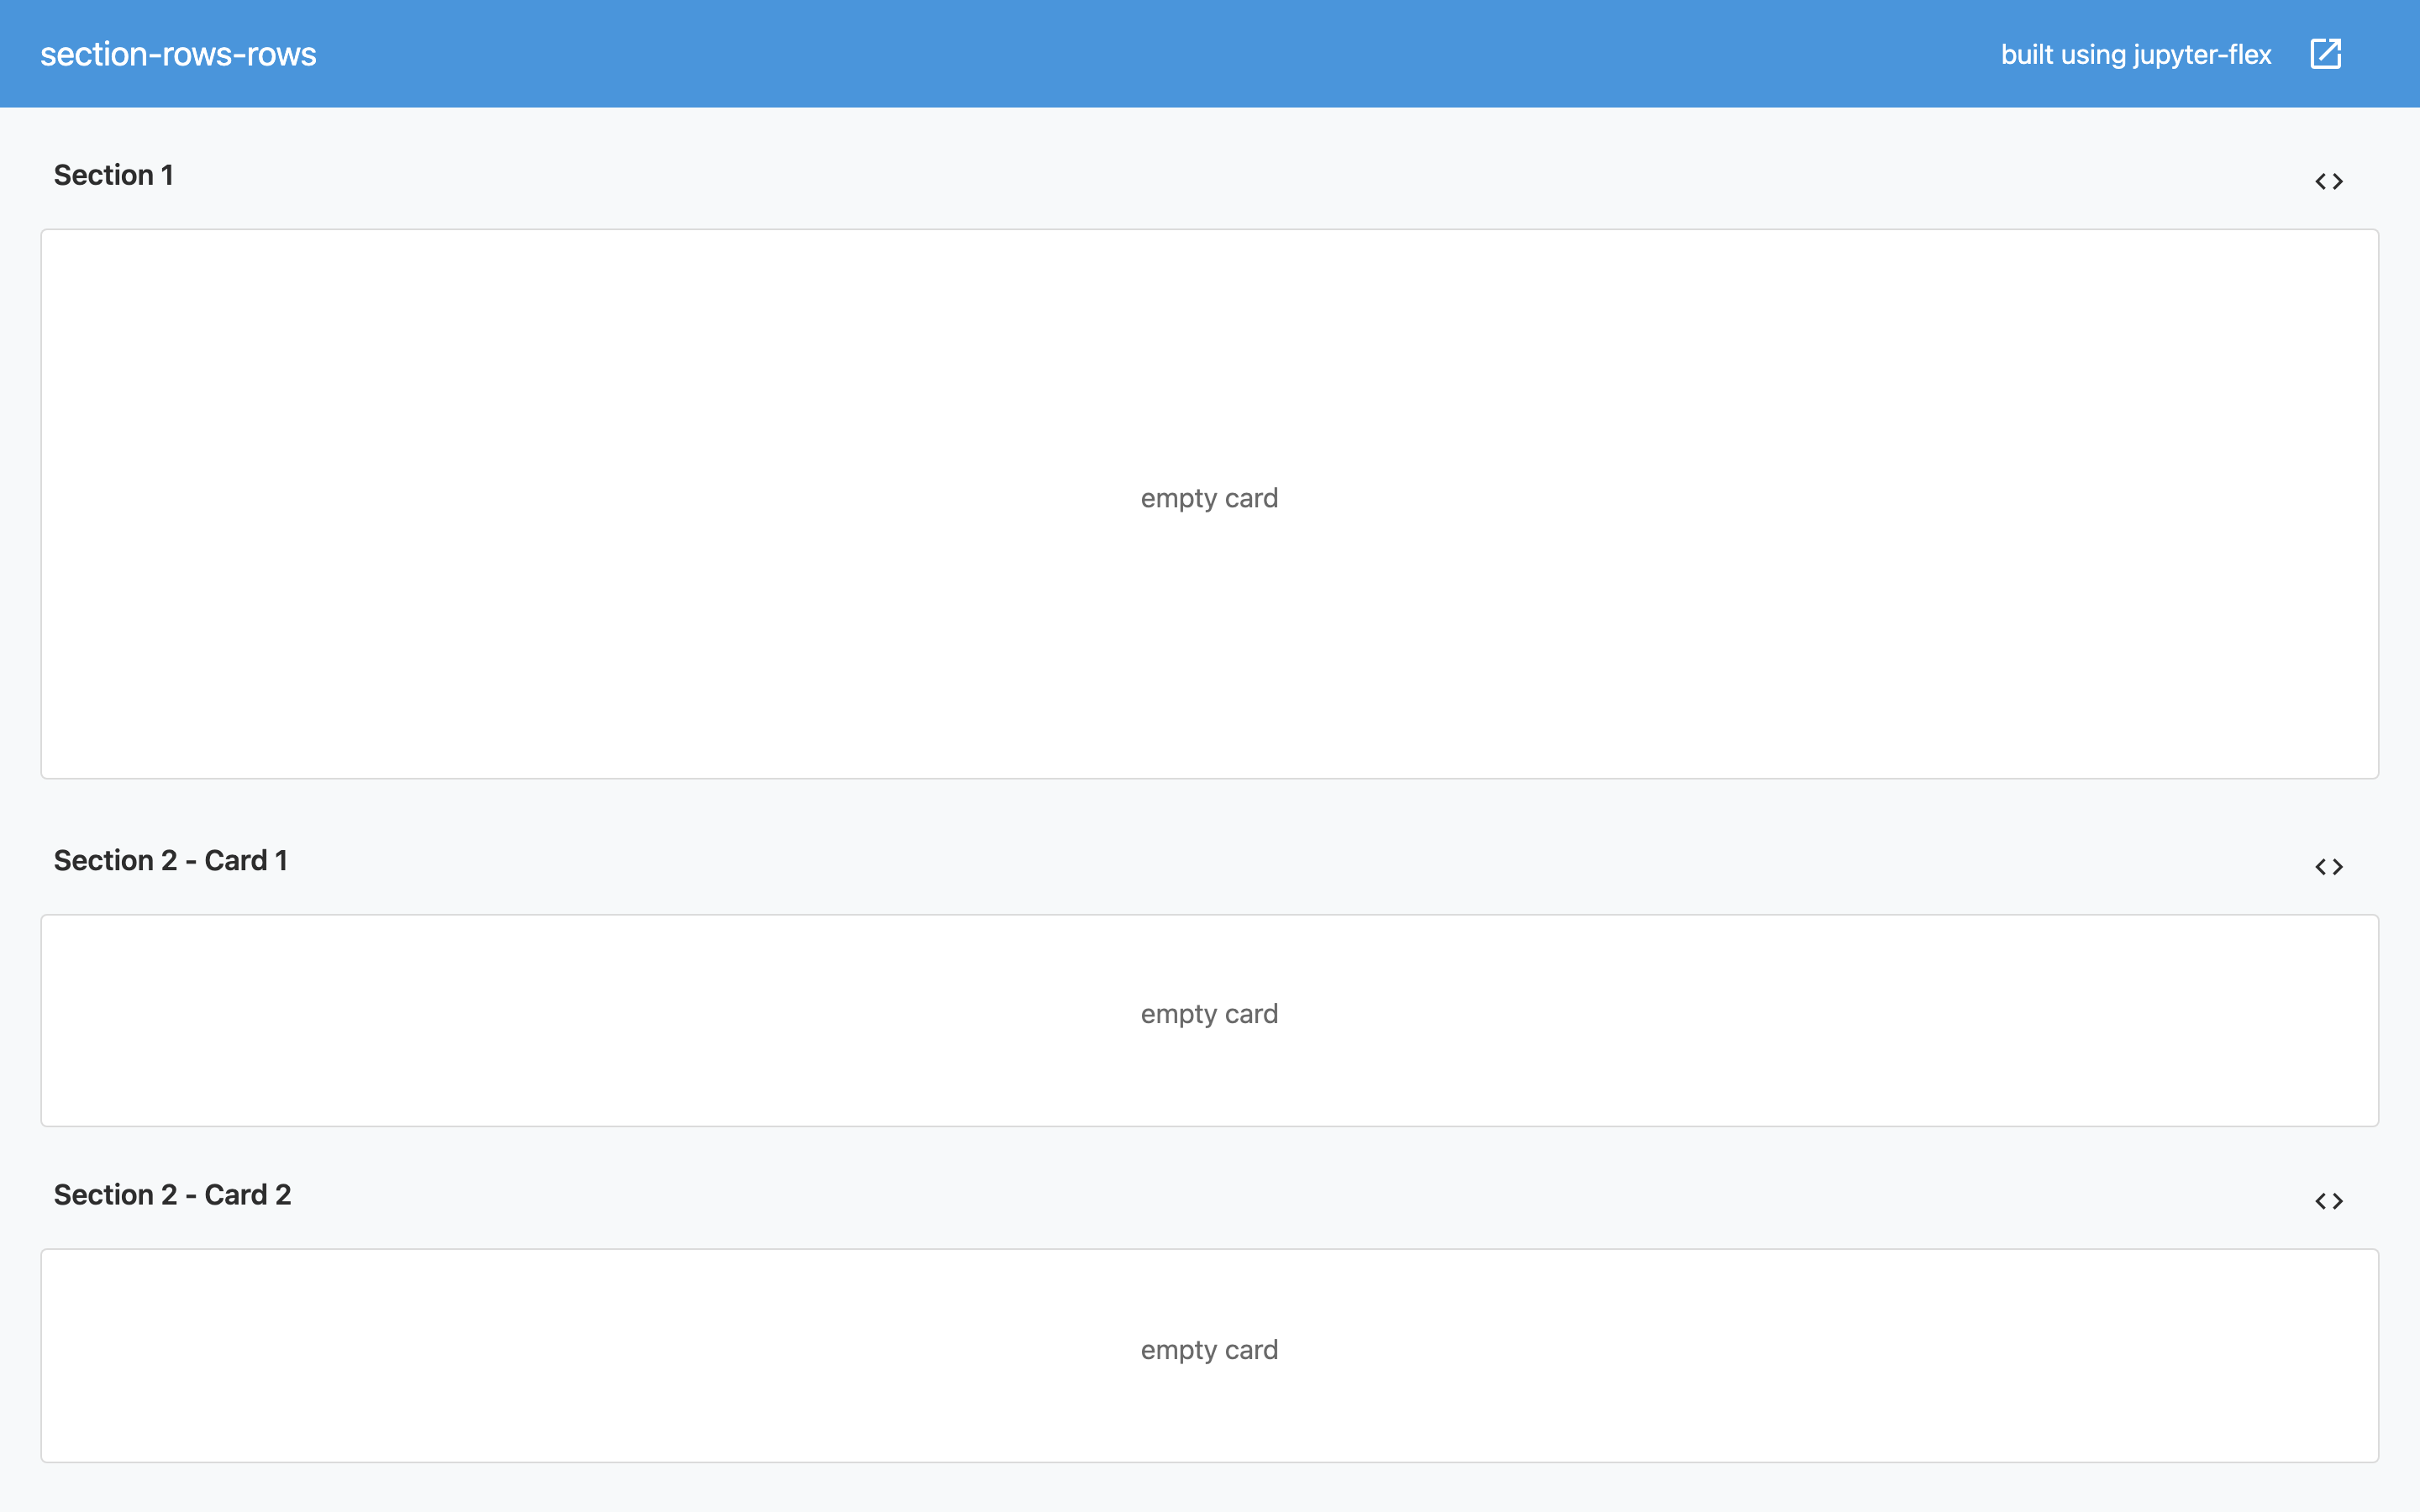
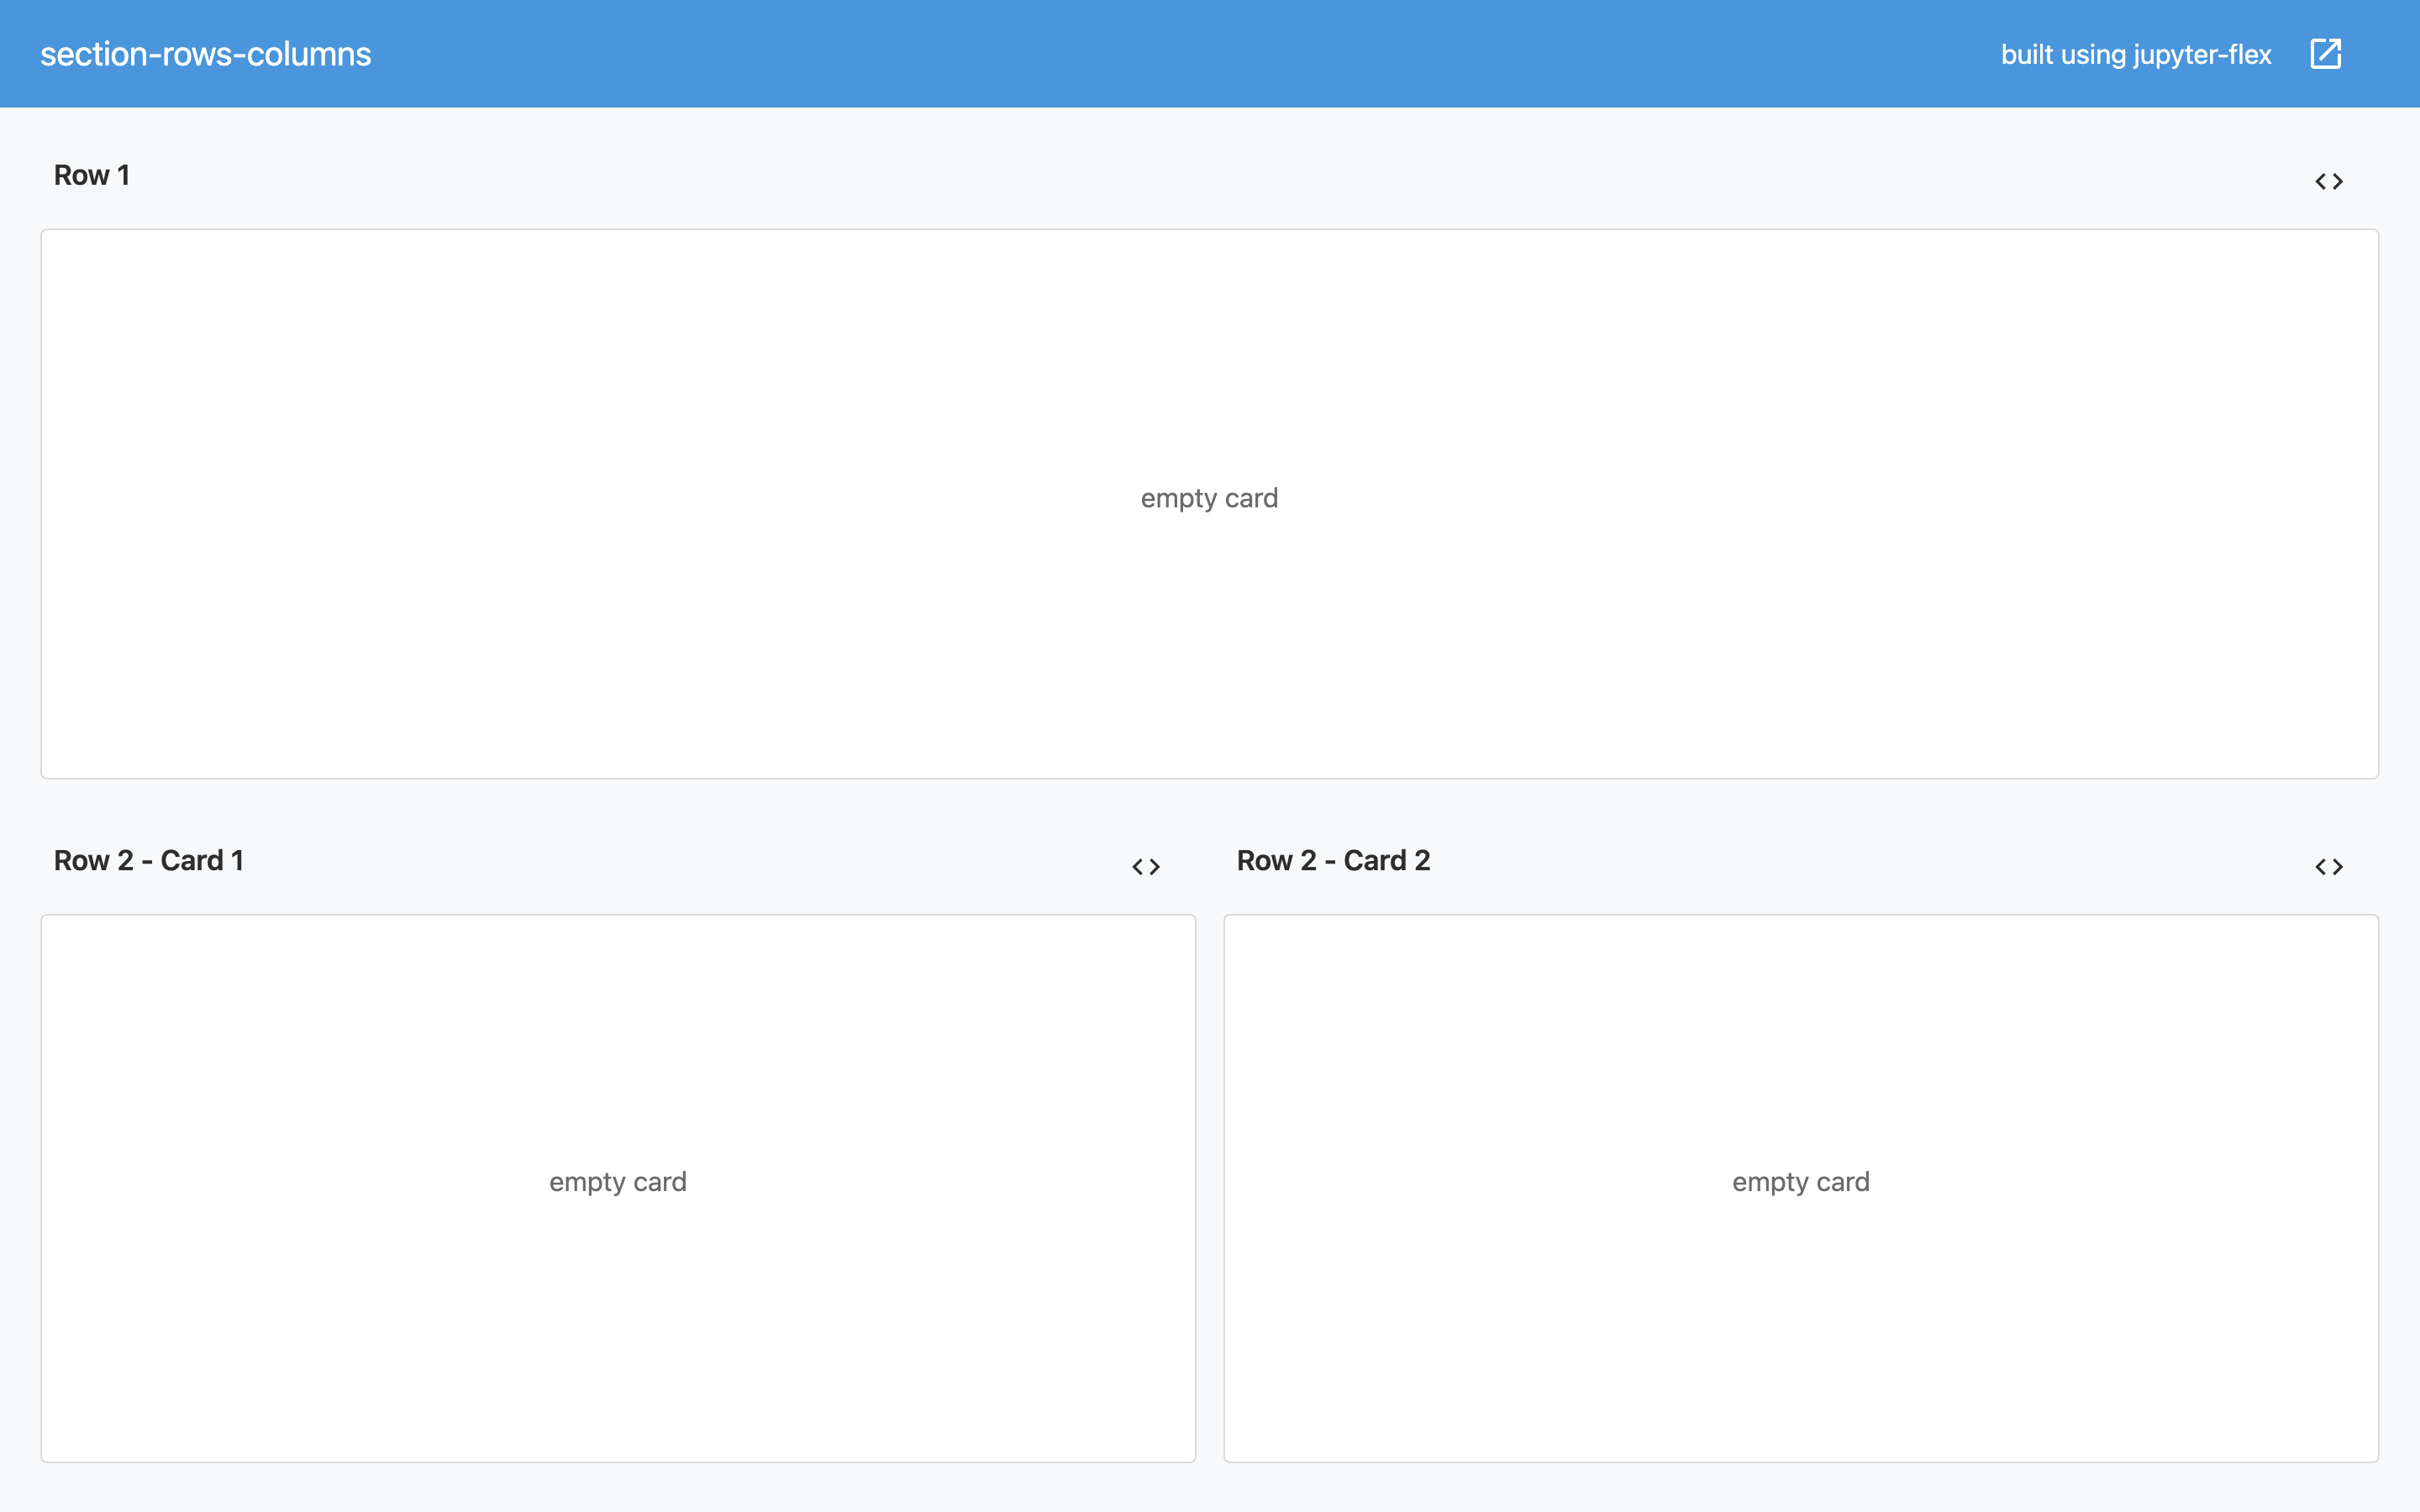
For example take this notebook that focuses most of the dashboard space on the top Section with one Card.
flex_orientation = "rows"
## Row 1
### Row 1
# <code>
## Row 2
### Row 2 - Card 1
# <code>
### Row 2 - Card 2
# <code>

What does the value of size mean?
Interally juptyer-flex uses Material UI and it heavily uses the Grid component.
The size tag is passed directly to the `xs` property of the Grid items.
These items size should add up to 12
Card size
In the same way that you can control Section proportions in a Page, you can control the Card proportions inside a Section using the size parameter as a tag in the Card header (level-3 markdown header: ###).
In the last example if we change these two cells:
### Row 2 - Card 1
# <code>
### Row 2 - Card 1
# <code>

Click on the image to open dashboard
Section Tabs
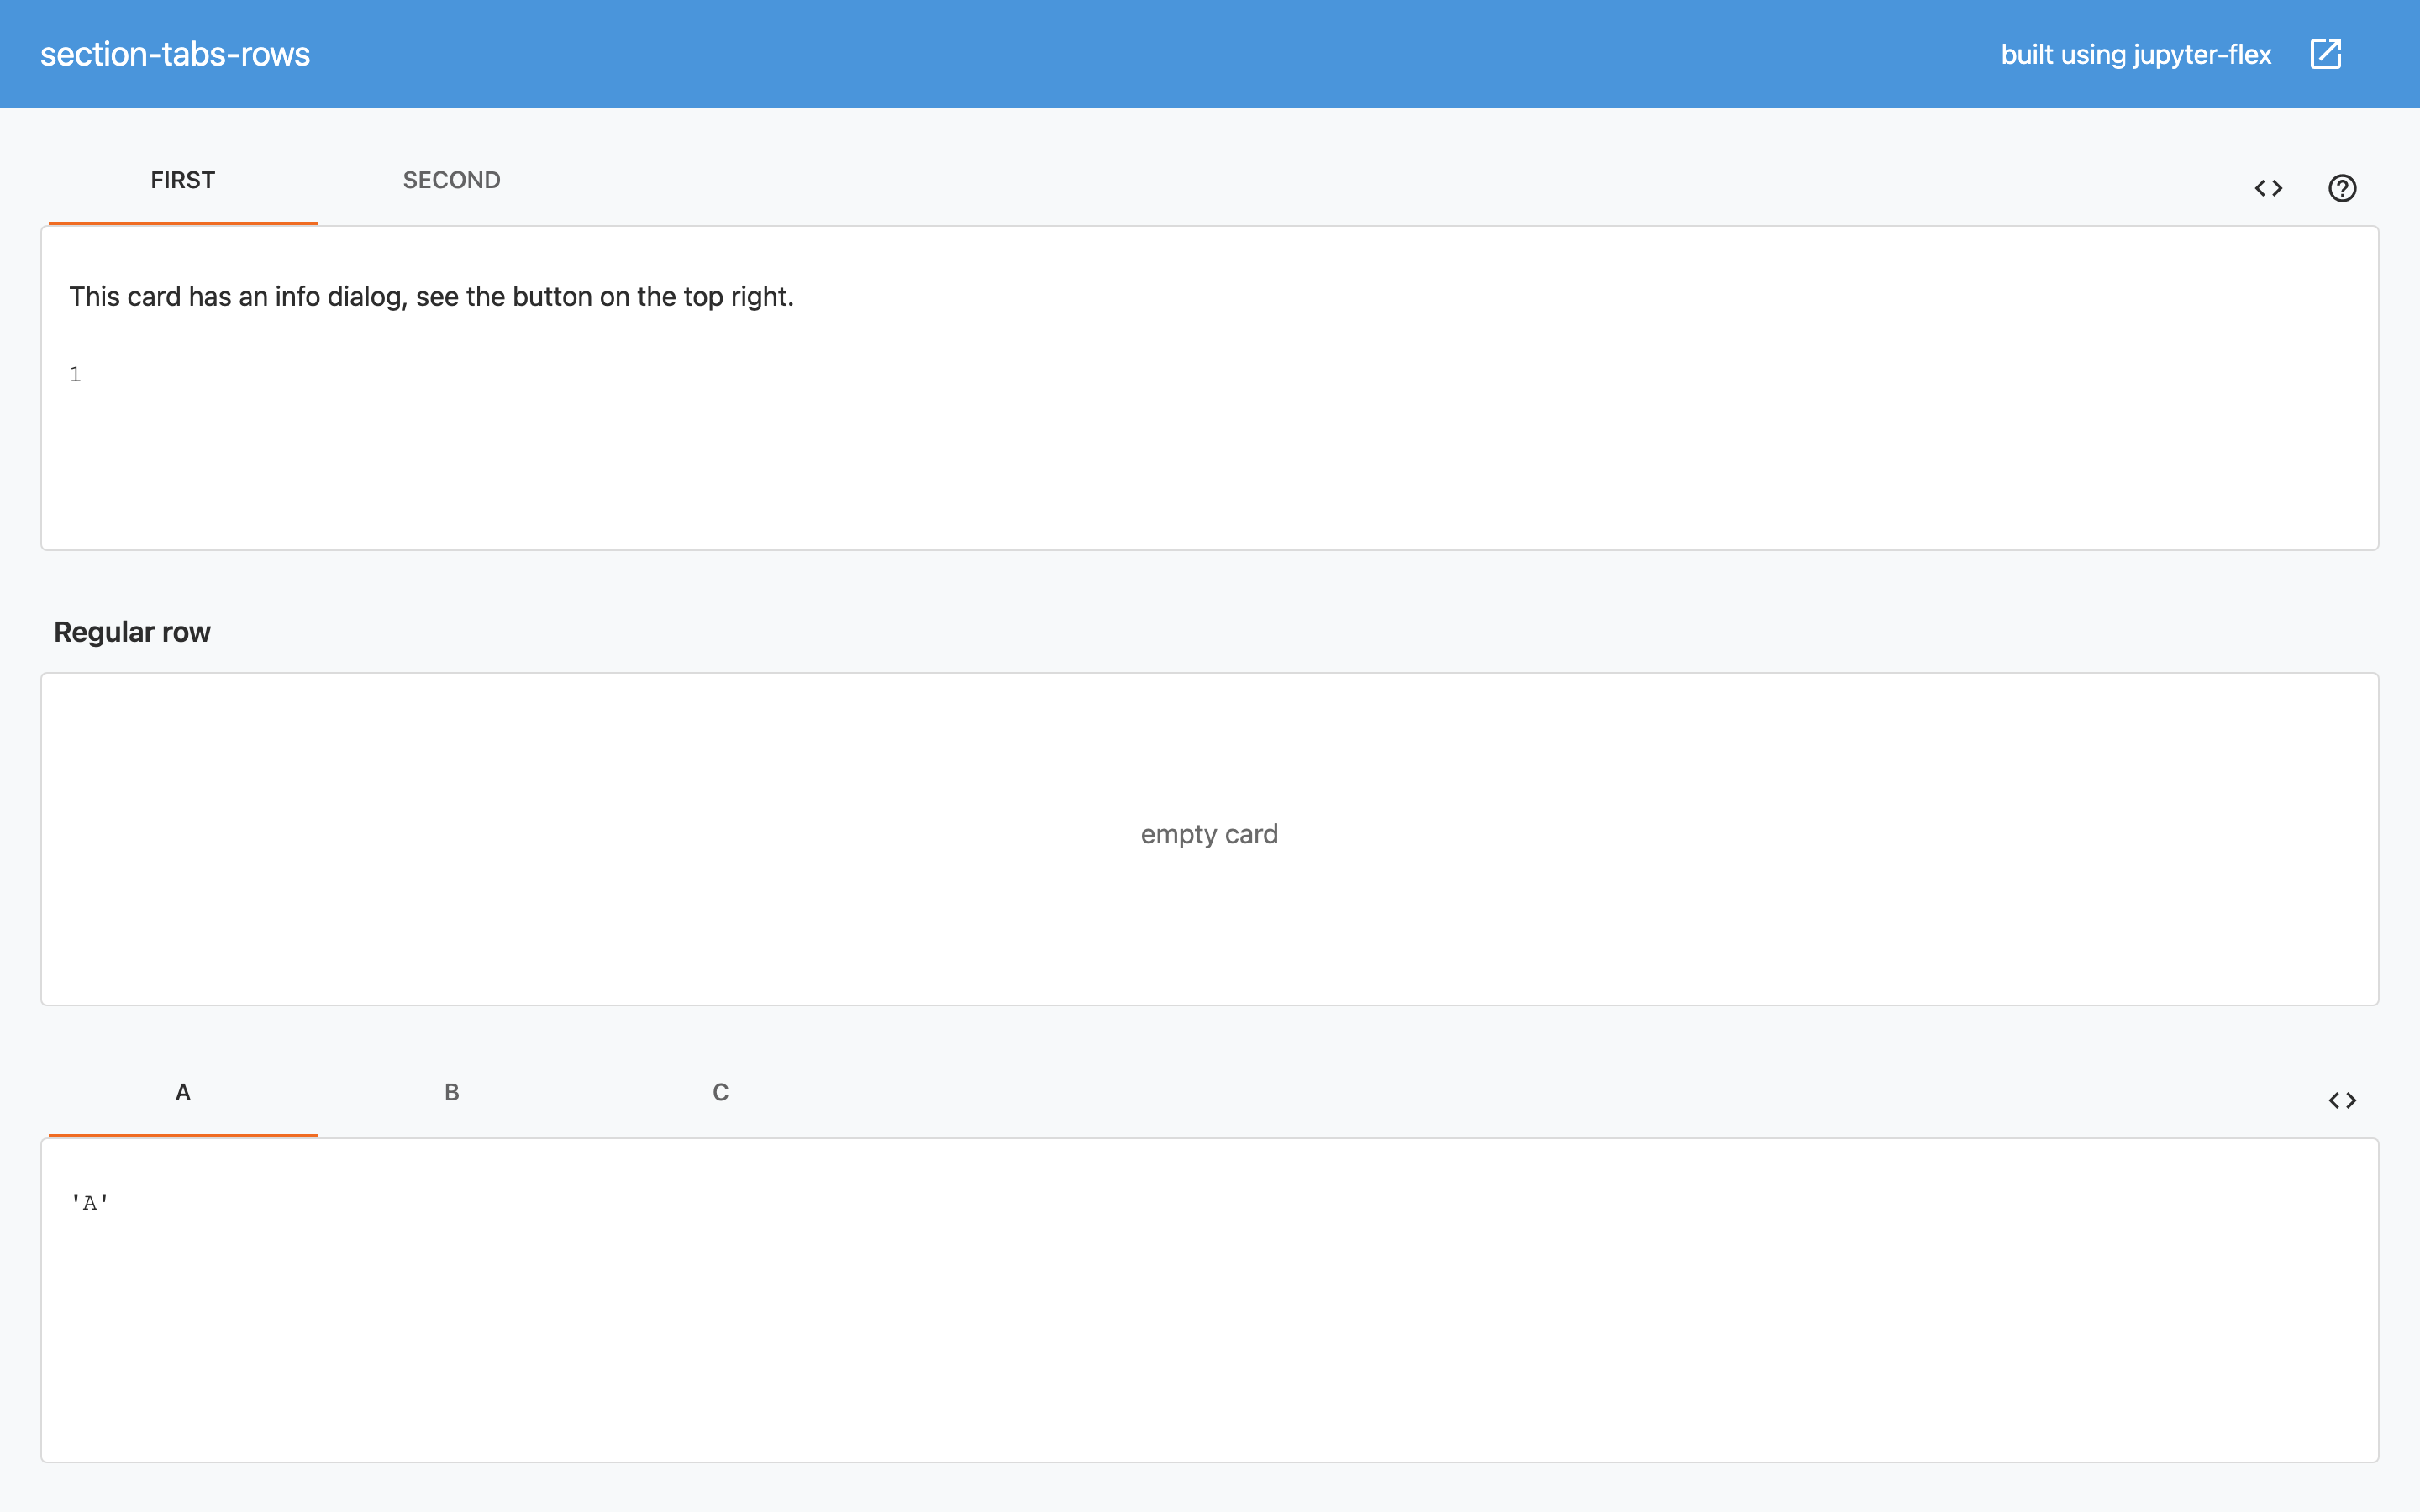
You can make a Section display all it's Cards as tabs making each Card it's own tab. This allows more screen space for each Card. Tabs are especially useful when you have a large number of components to display.
To do this just tag a Section with tabs (the one with the level-2 markdown header: ##).
For example this notebook:
## Column 1
### Tab 1
1
1
### Tab 2
2
2
## Column 2
### Regular Column
# <code>
## Column 3
### Tab A
"A"
'A'
### Tab B
"B"
'B'
### Tab C
"C"
'C'

Click on the image to open dashboard
Pages
For bigger dashboards with a lot components you can divide the dashboard into multiple pages using level-1 markdown headers (#).
A Page is an object that holds one or more Sections, those Sections can be shown as columns (default) or rows inside the Page.
If a dashboard has one or more Pages the top navigation of the dashboard will include links to change between those.
Page parameters, such as orientation and size, can be overwritten by tagging the level-1 (#) markdown header cell.
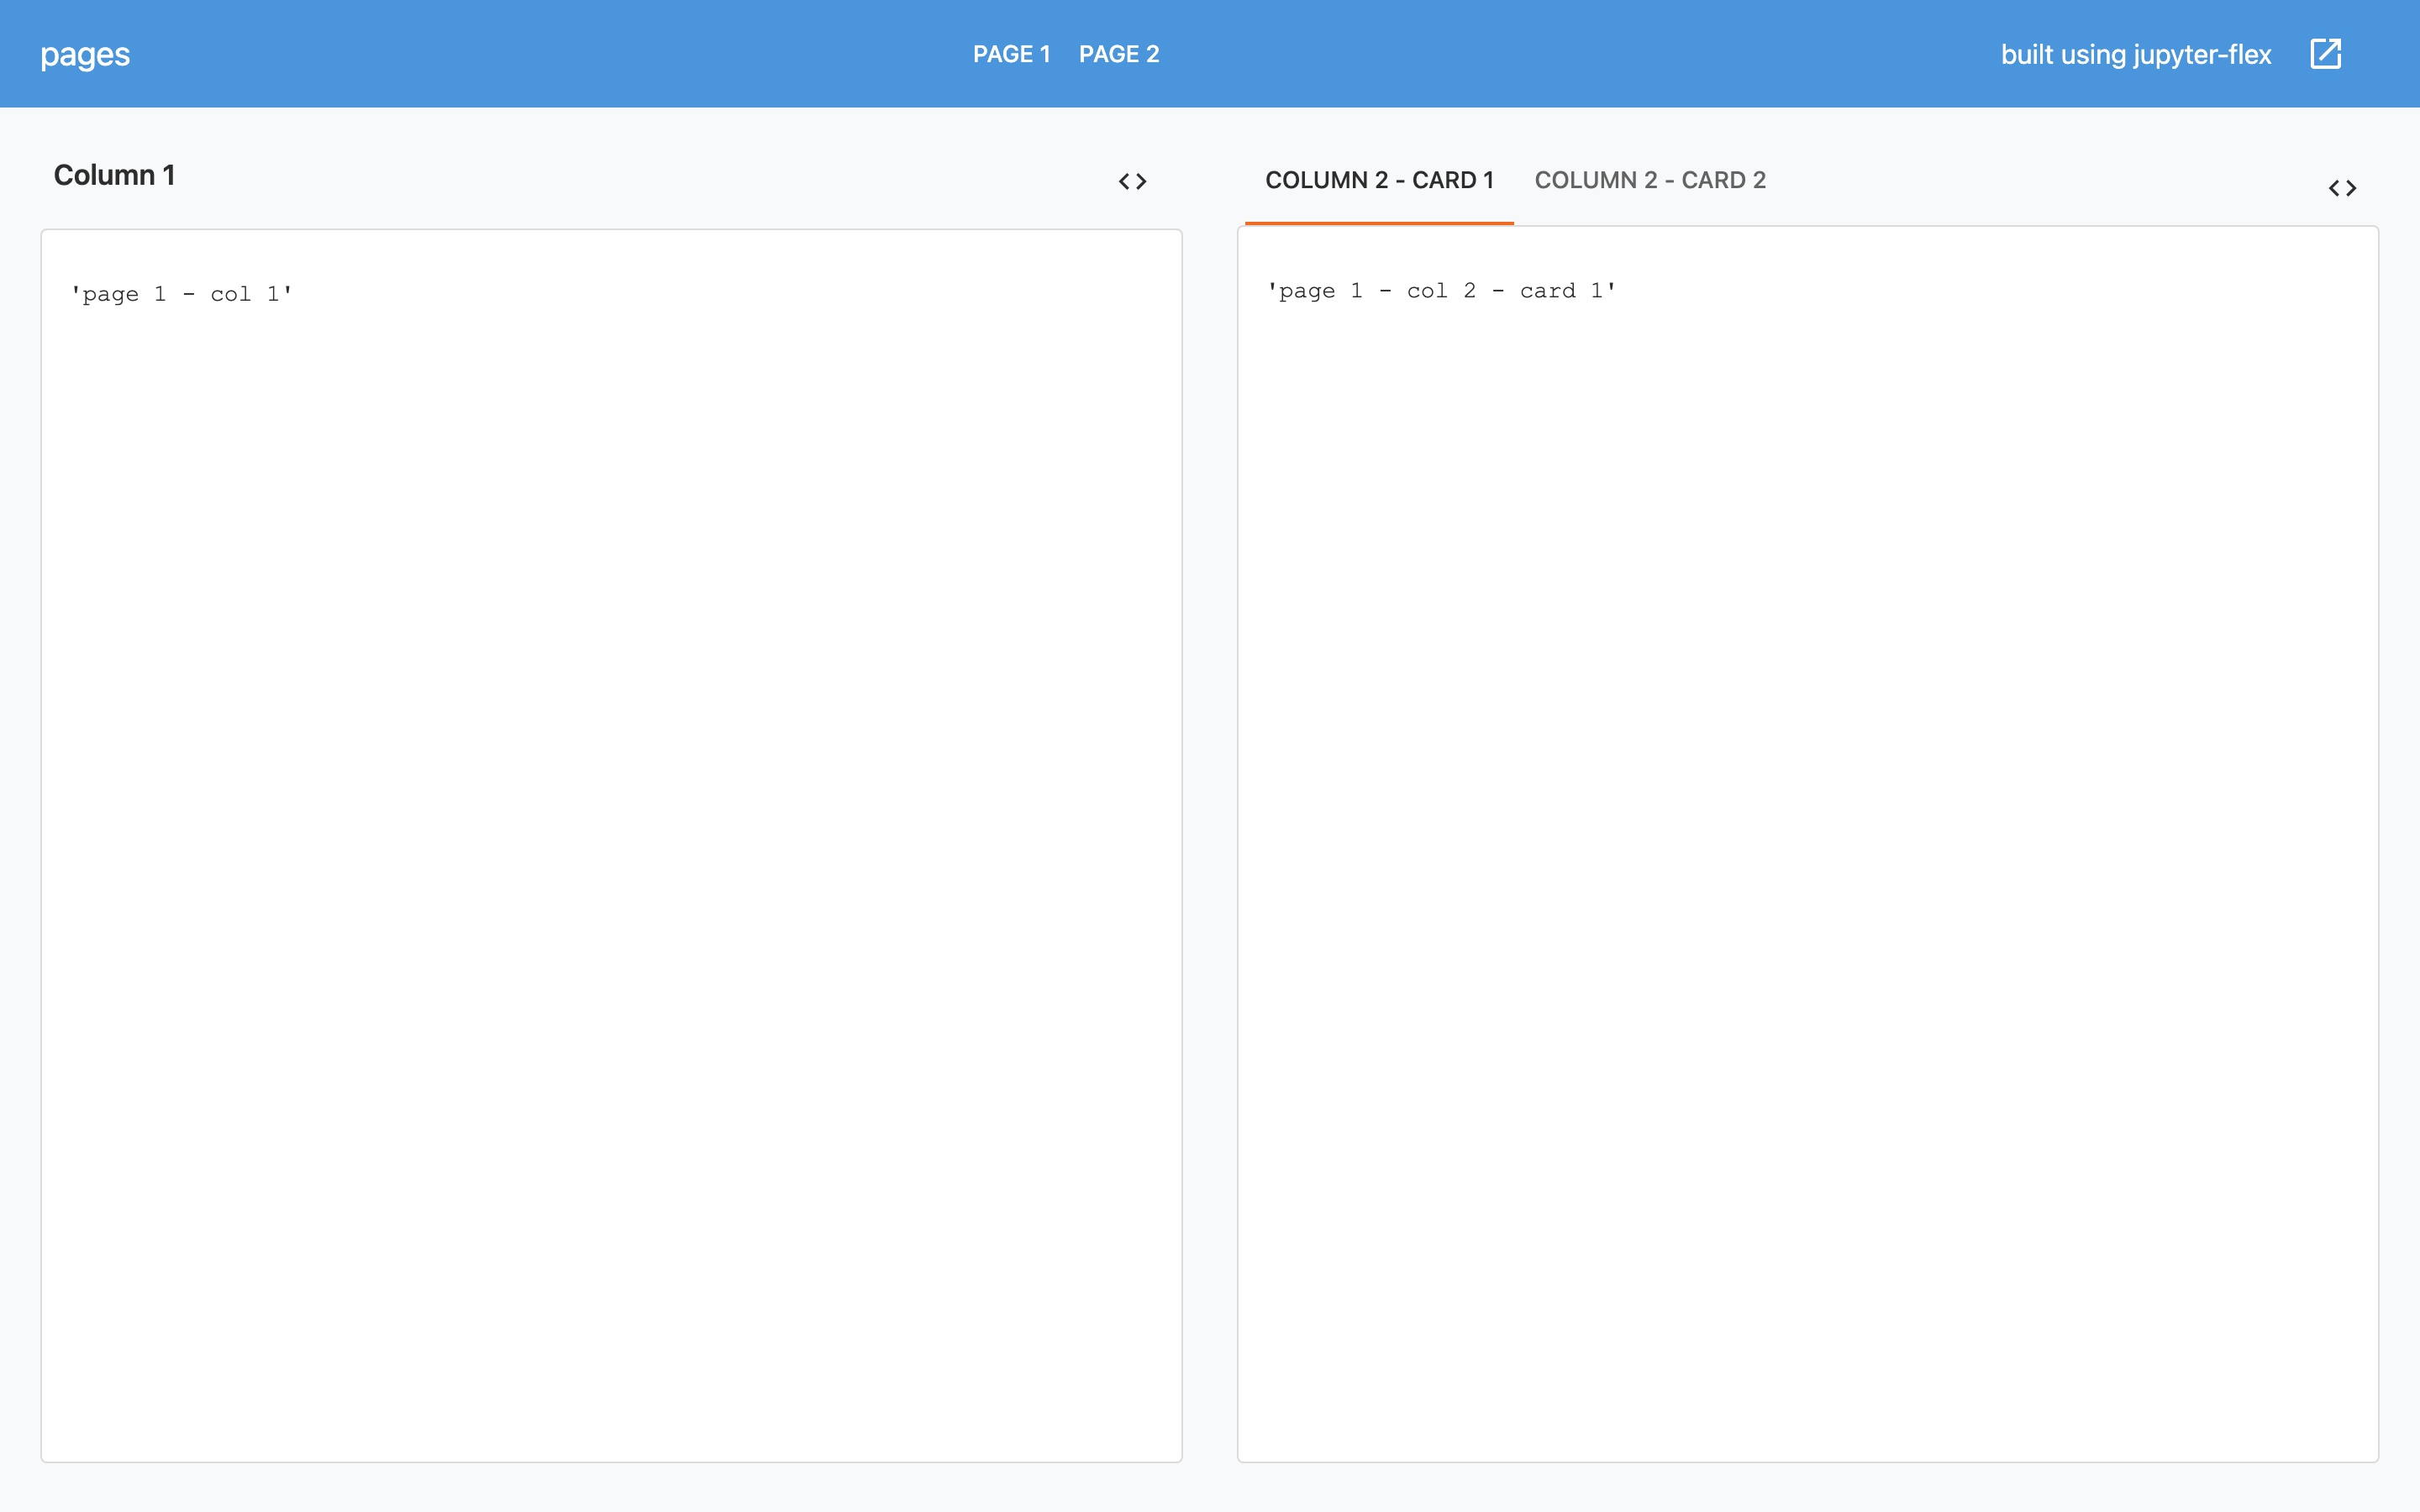
Take this example Notebook with 2 Pages and multiple sections (including tabs):
# Page 1
## Column 1
### Column 1
"page 1 - col 1"
'page 1 - col 1'
## Column 2
### Column 2 - Card 1
"page 1 - col 2 - card 1"
'page 1 - col 2 - card 1'
### Column 2 - Card 2
"page 1 - col 2 - card 2"
'page 1 - col 2 - card 2'
# Page 2
## Row 1
### Row 1
"page 2 - row 1"
'page 2 - row 1'
## Row 2
### Card 1
"page 2 - row 2 - card 1"
'page 2 - row 2 - card 1'
### Card 2
"page 2 - row 2 - card 2"
'page 2 - row 2 - card 2'
Click on the image to open dashboard
Sidebars
Sidebars are one special type of Section or Page. They behave in the same way as regular Section, they can contain one or more Cards that will be shown in the Sidebar of the dashboard.
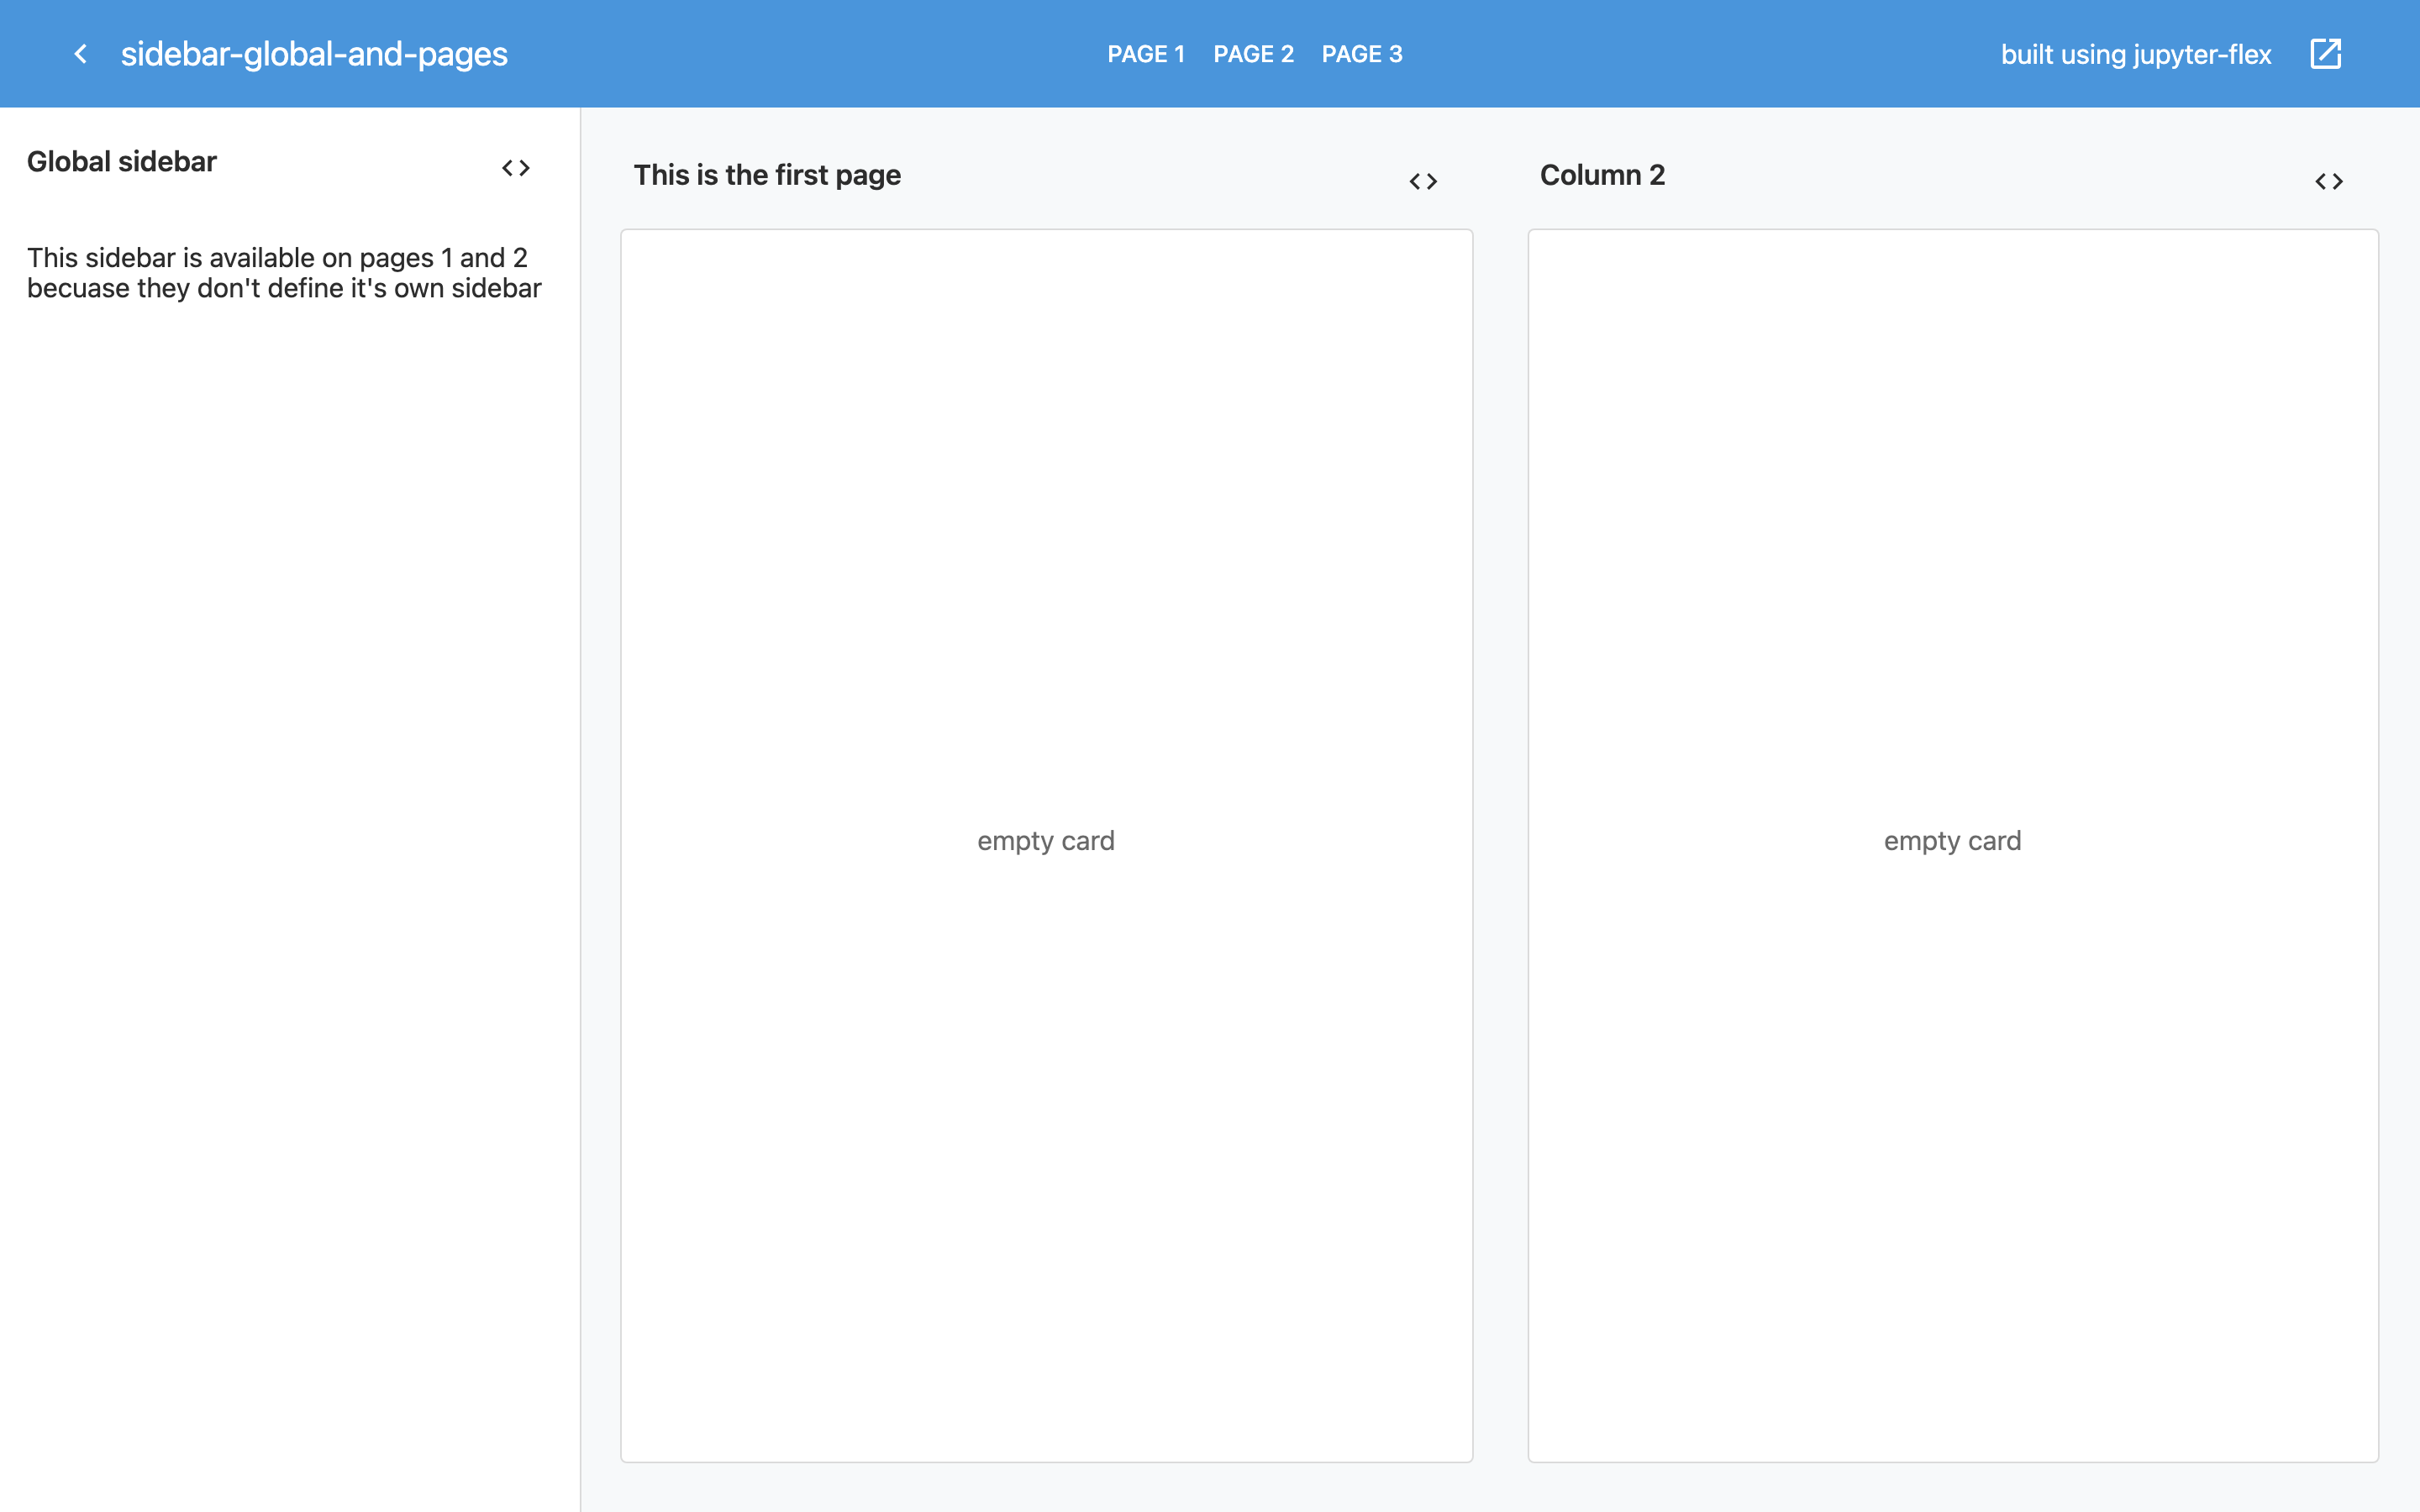
If you tag a Page with sidebar it will be a global Sidebar, meaning that all pages will have the same sidebar.
If you tag a Section with sidebar then it will only appear for the page that contains that Section.
This is mostly useful when defining inputs and using Jupyter widgets, see Voila and Widgets but it can also be used to display other type of information.
This example uses a global sidebar by tagging the first page with sidebar.
### Sidebar
"""
The sidebar is the sidebar of the dashboard.

It will always be there even after switching pages.

This content is a regular Card, for example *this* **is** [markdown](https://daringfireball.net/projects/markdown/).
"""
""
''
### This is a second card
# Since we have two cards in the sidebar the content was split equaly as it happens in Sections by default but it can be controlled by the `size` tag.
# This is a code cell output on the side bar
# Page 1
## Col 1
### This is the first page
# <code>
## Col 2
### Column 2
# <code>
# Page 2
## Row 1
### This is the second page
# <code>
## Row 2
### Row 2
# <code>

Click on the image to open dashboard
Section sidebar
If you want a sidebar that is only available to one of the Pages, tag a Section with sidebar.
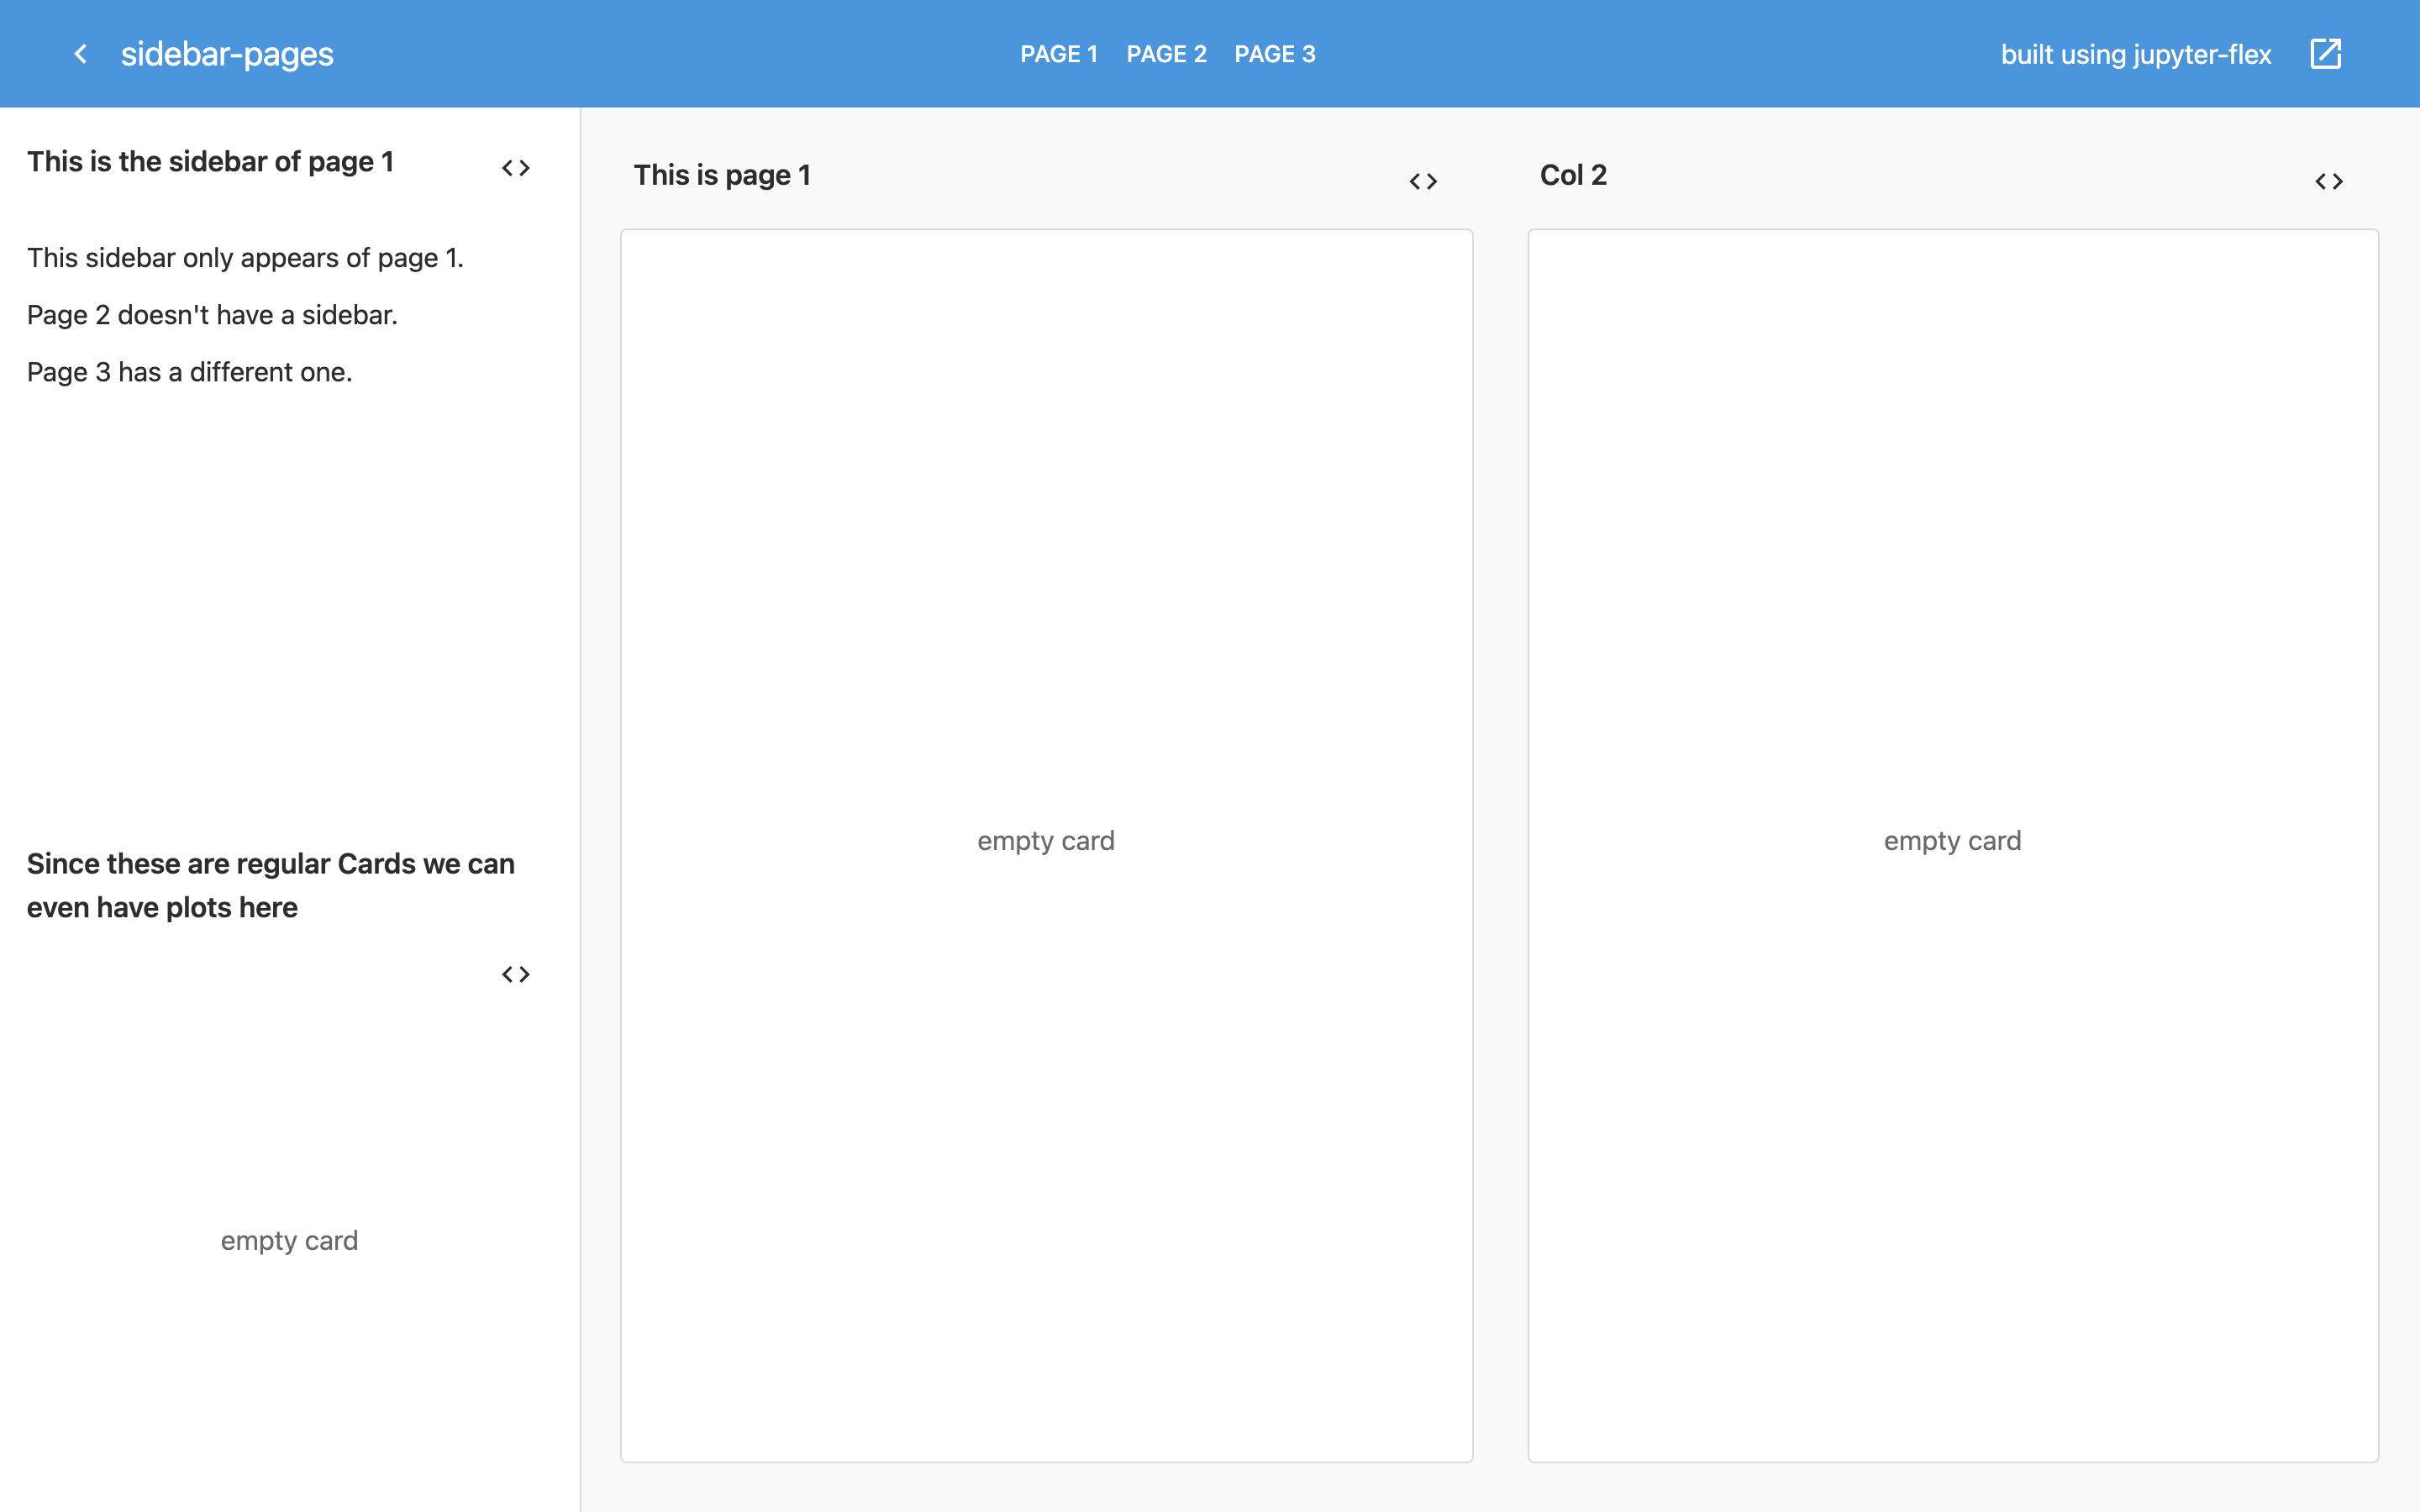
Click on the image to open dashboard
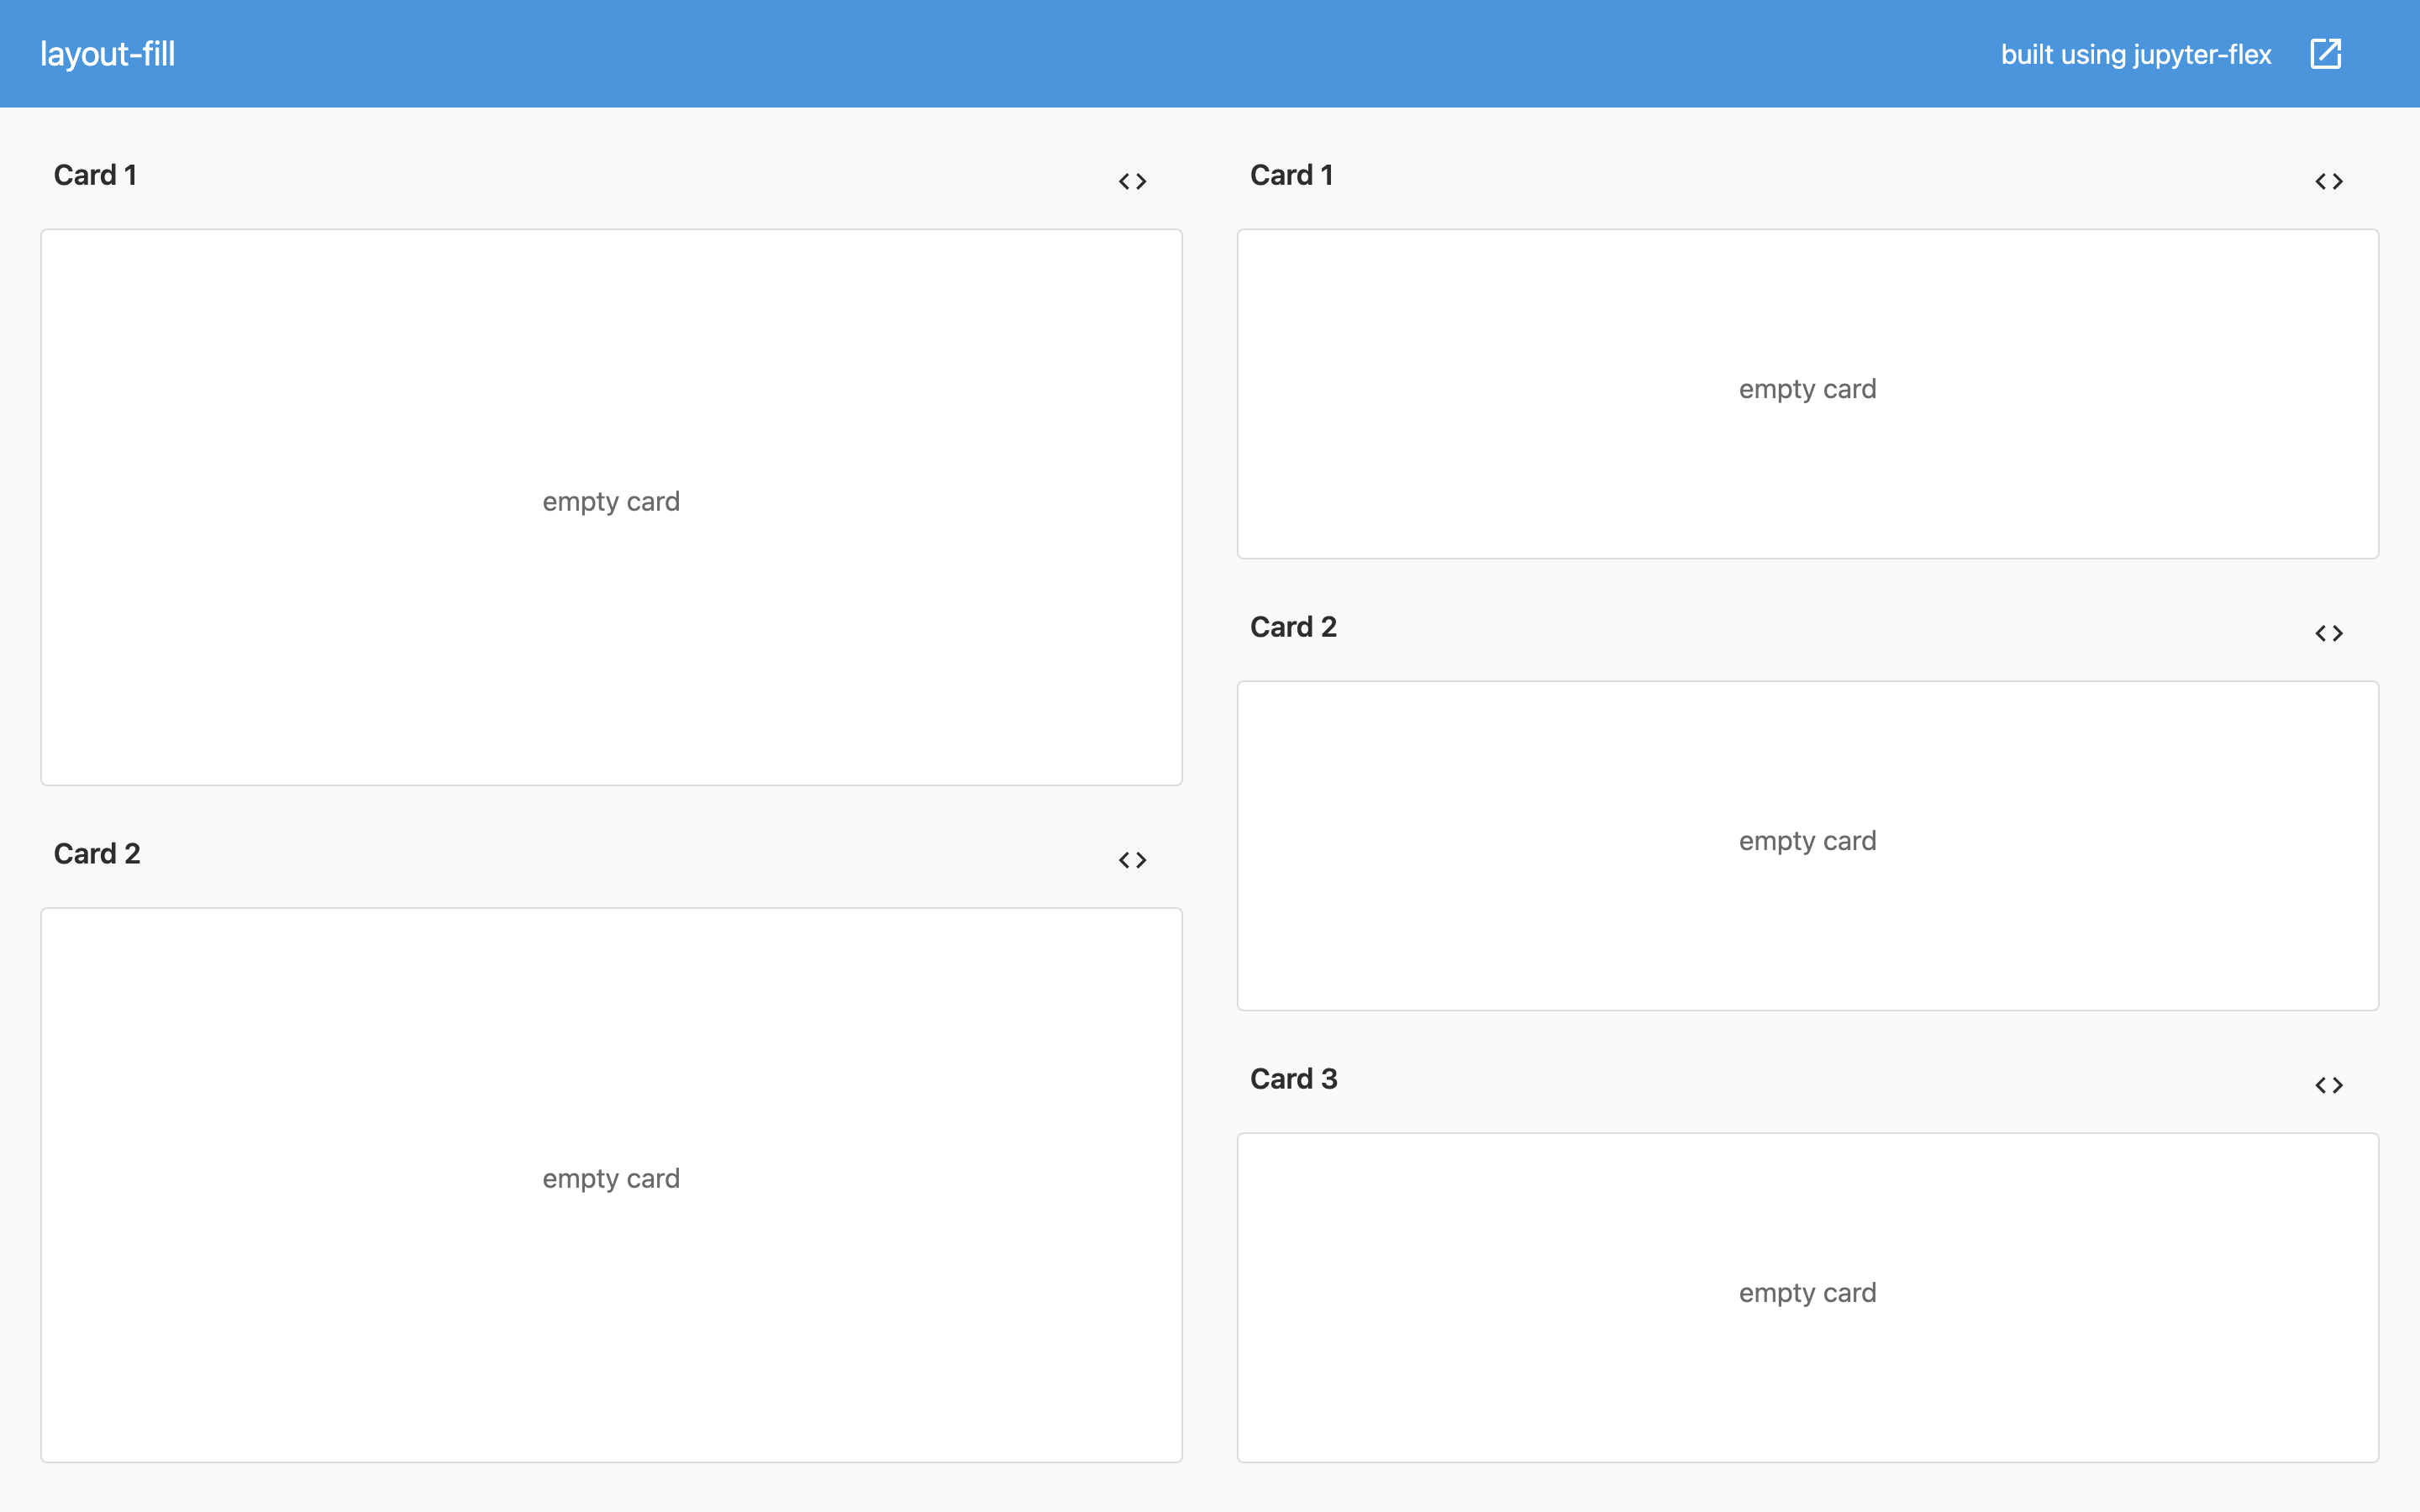
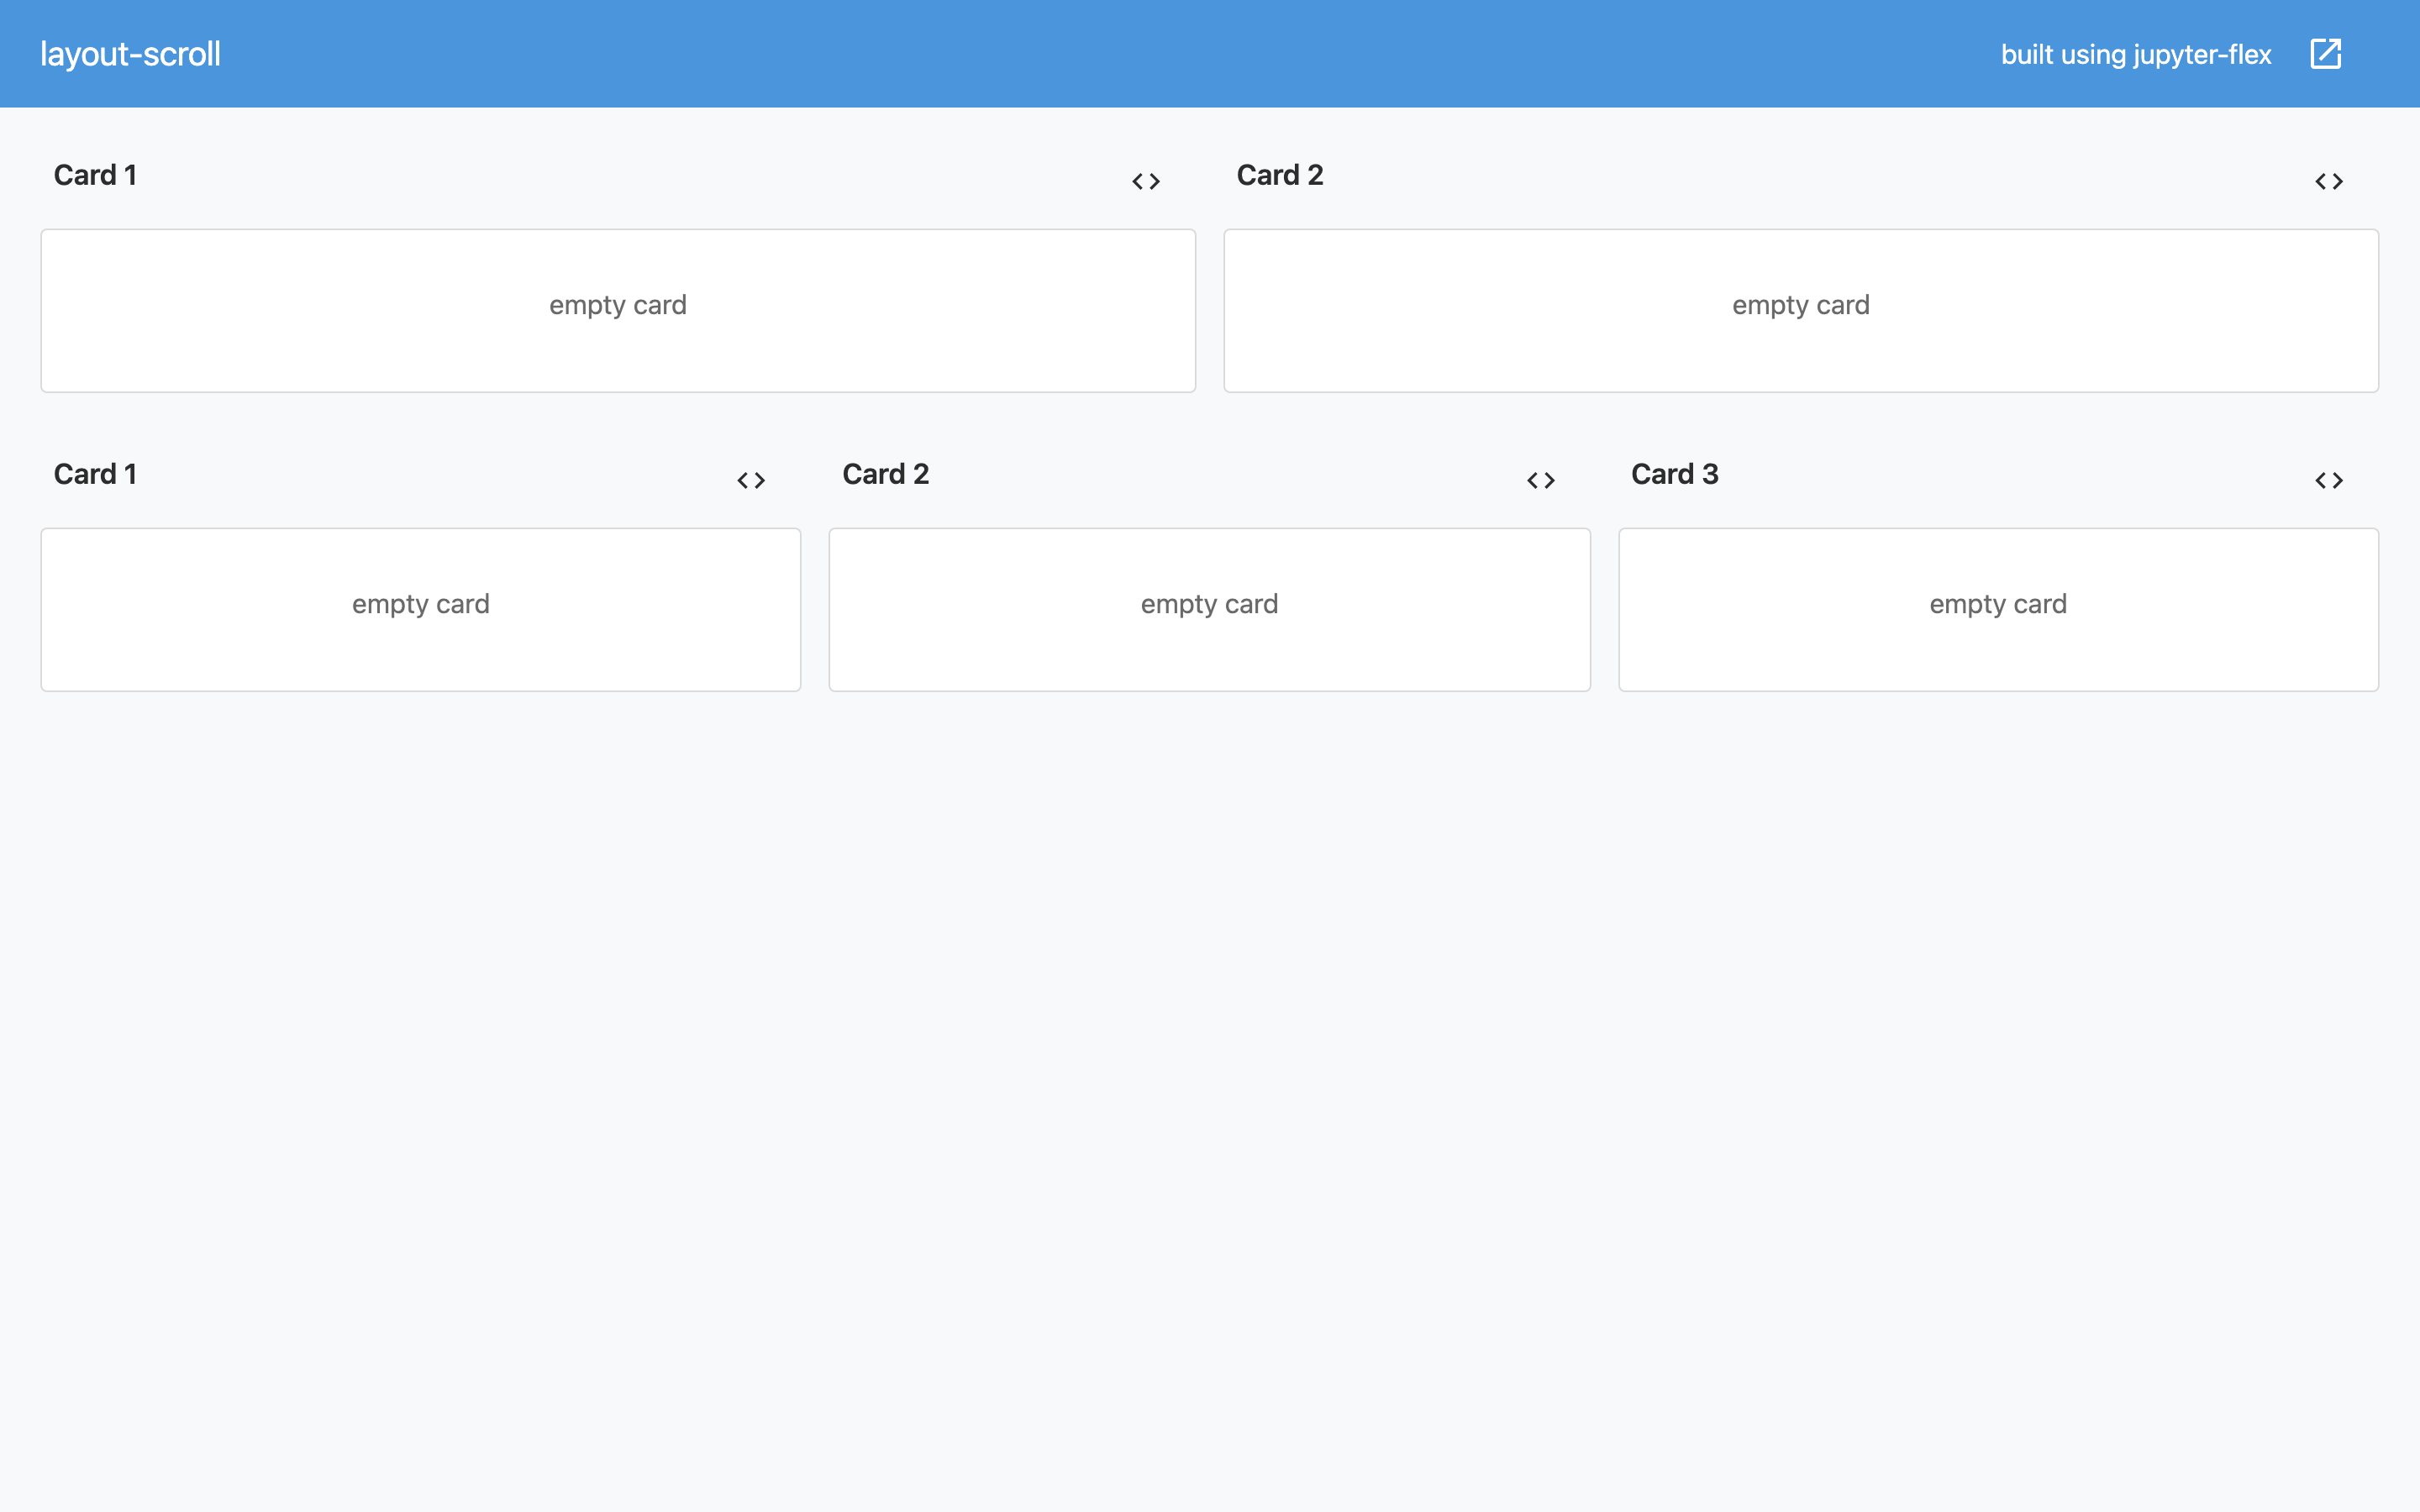
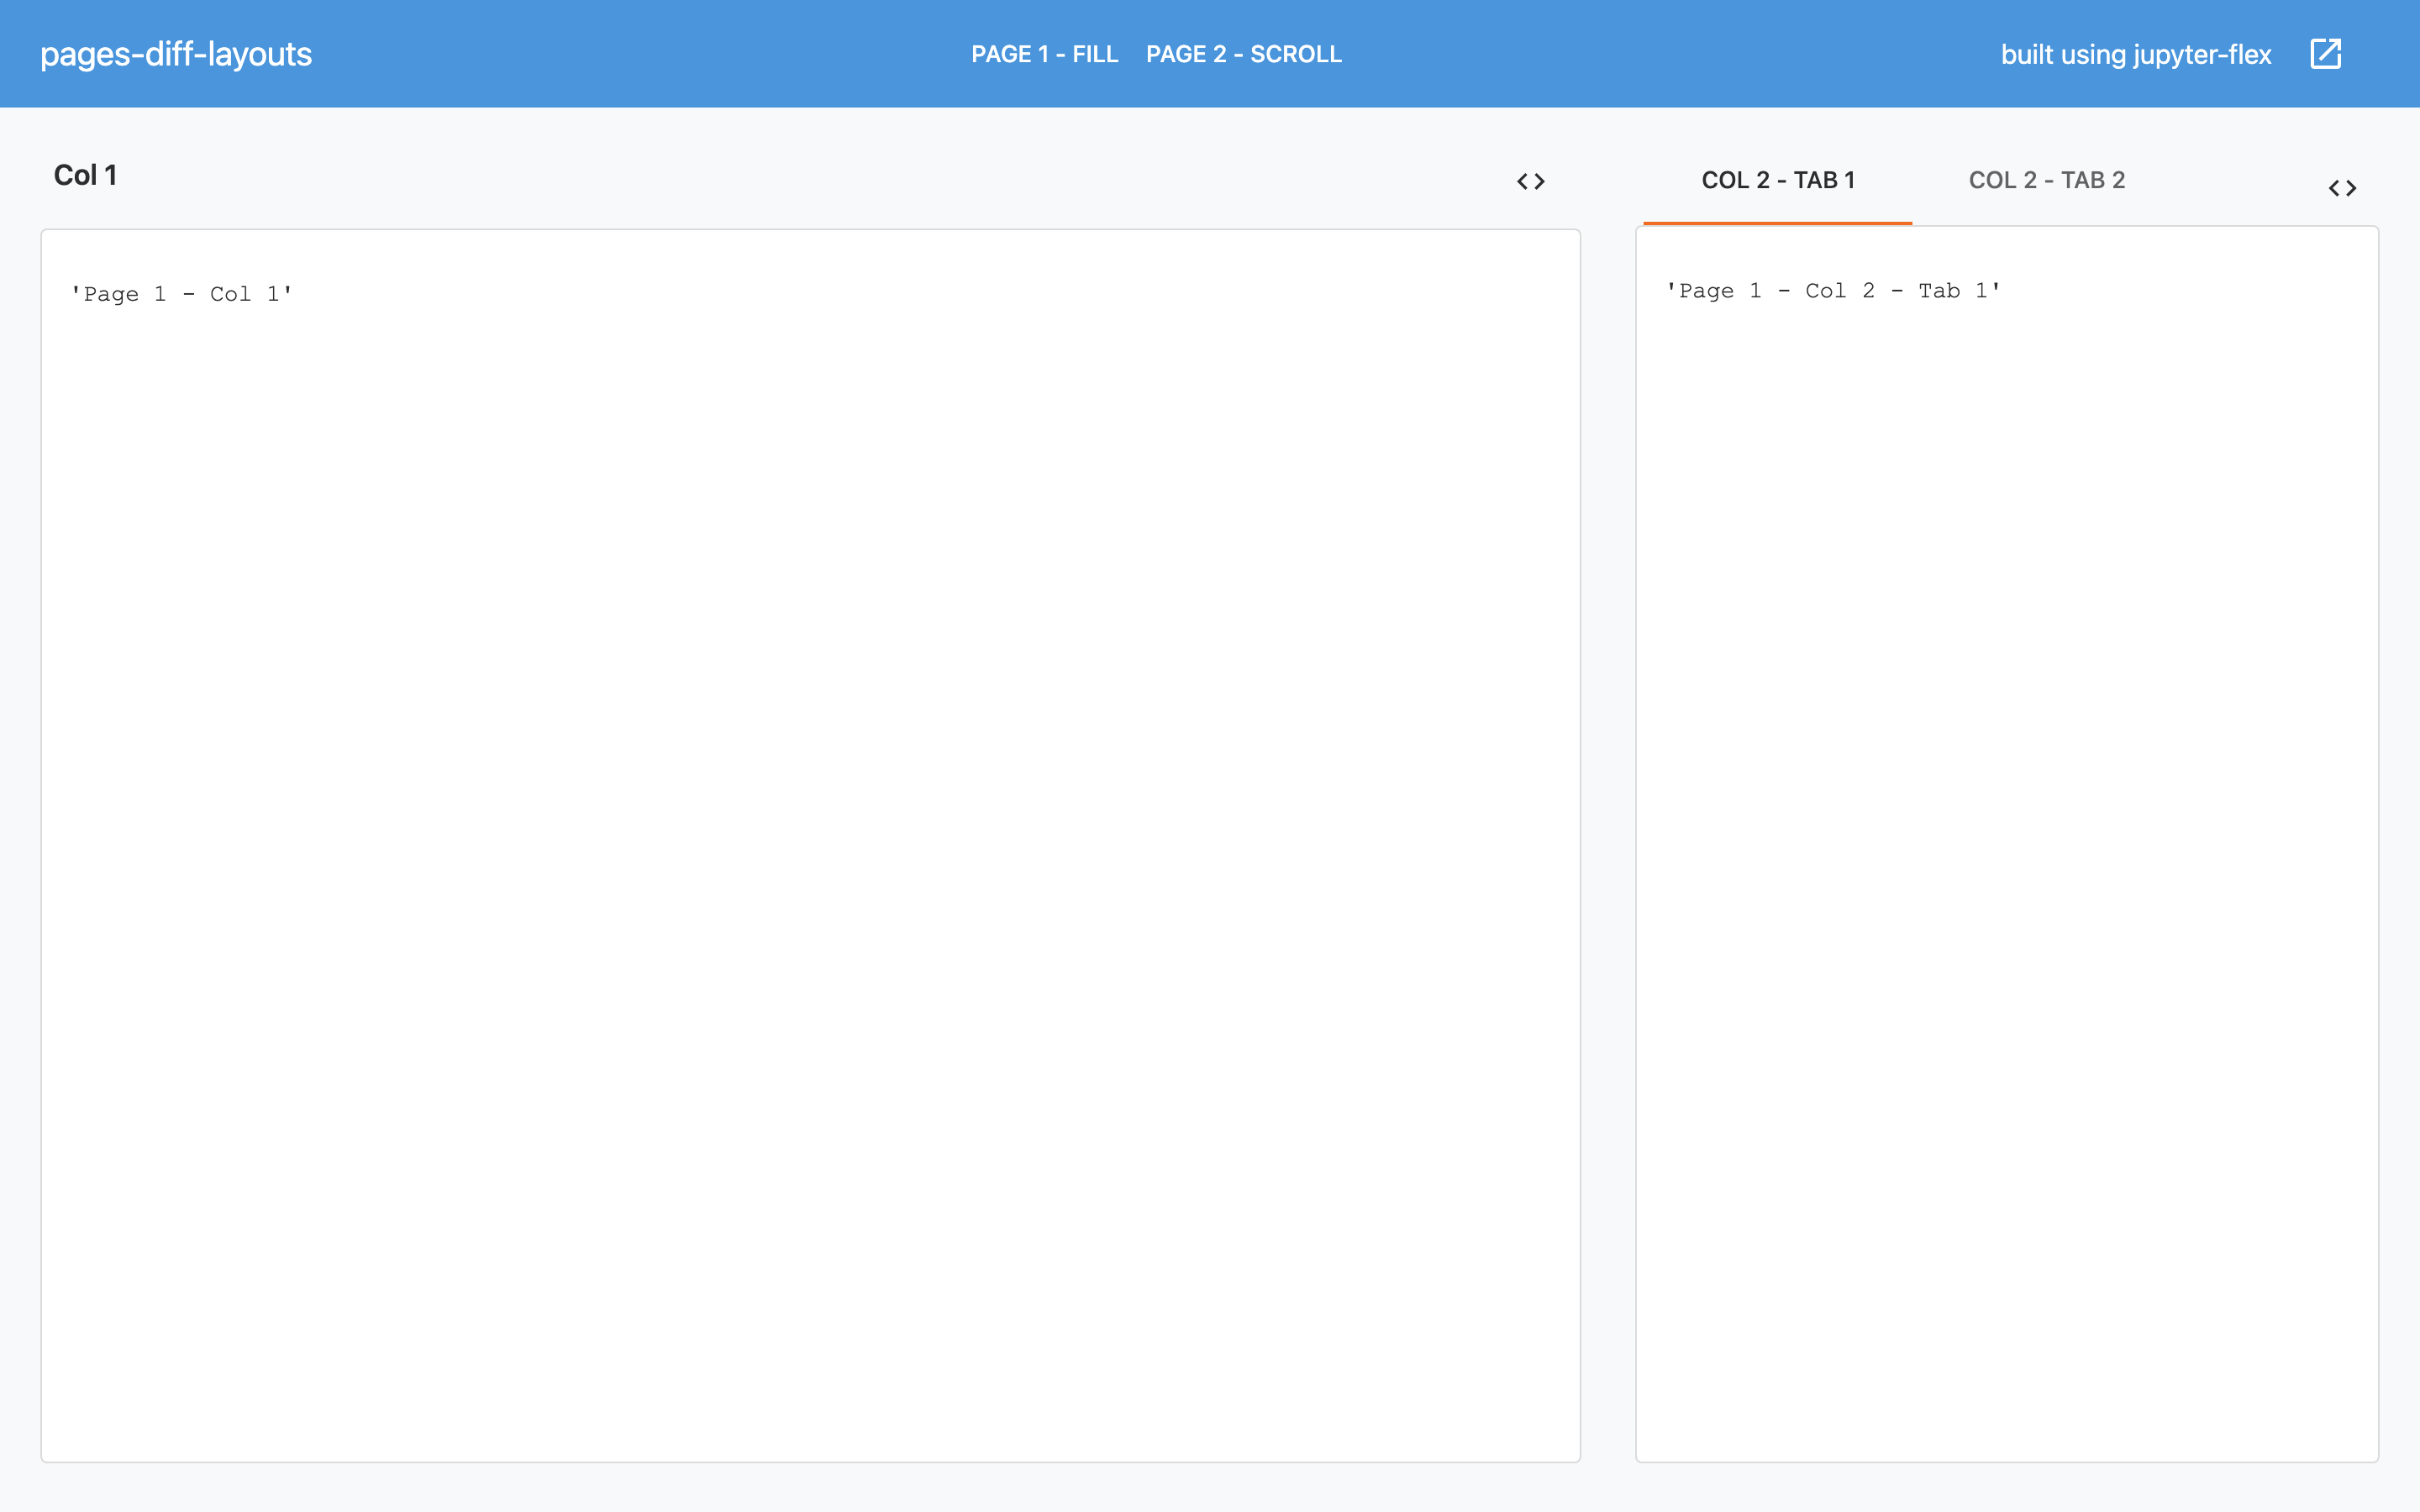
Vertical Layouts: Scroll
By default Jupyter-flex components are laid out to fill the height of the browser. So that multiple components (Sections, Cards) get expanded to the available space and there is no vertical scroll in the body.
This is a good default that works well for a small to medium number of components, however if you have lots of charts you’ll probably want to scroll rather than fit them all onto the page.
You can control this behavior globally using the flex_vertical_layout option which has a default value of fill, change it to scroll to layout charts at their natural height, scrolling the page if necessary.
flex_vertical_layout = "scroll"
This can also be set for each page using the layout=scroll tag.
Examples